AI Graph Generator

Upload the data and name the comparison you need to show. Ottermind drafts a labelled chart, writes the takeaway, and keeps the source rows in reach so you can check the totals before sharing.

A graph you can check, not just download

Most AI graph generators stop once the picture looks plausible. This one keeps the work around it. Bring a spreadsheet, a CSV export, or a pasted table, name the comparison you need to show, and Ottermind drafts the chart with labelled axes and a written takeaway. The rows stay in the project so you can check the totals before the chart goes into a deck, or into a report you build with AI Report Generator.

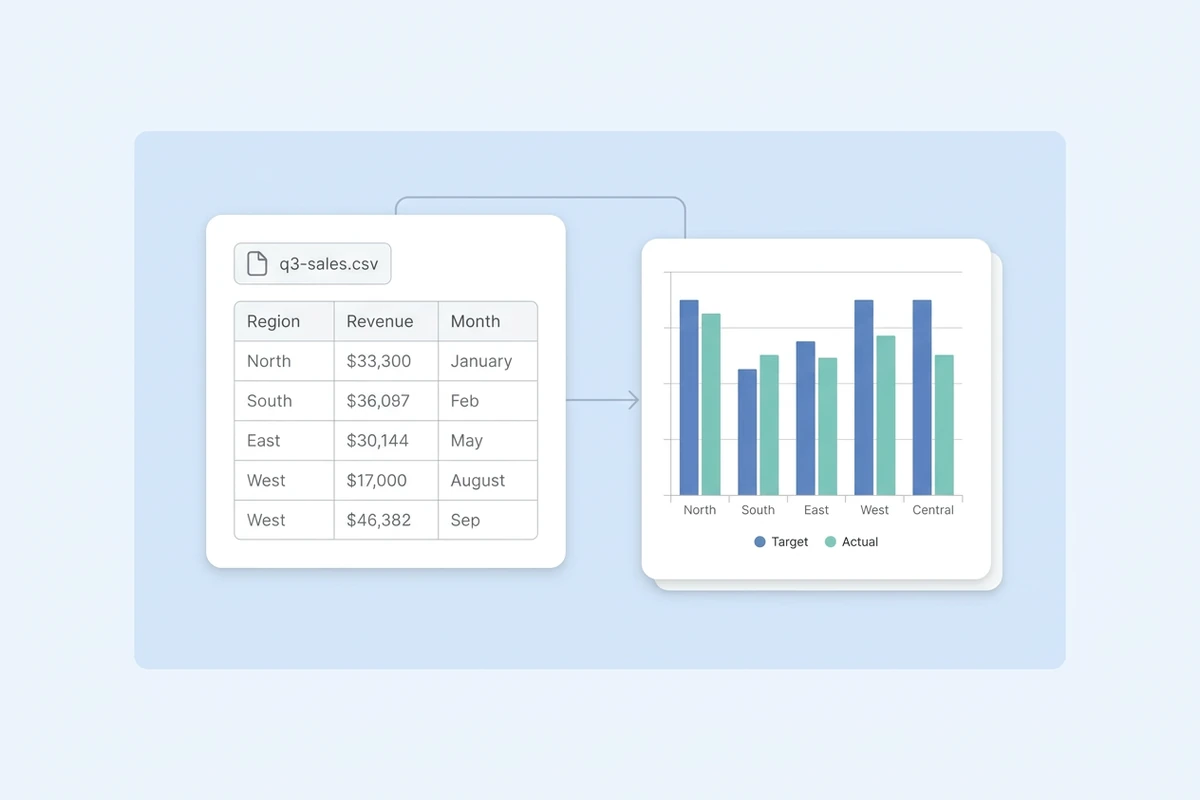
A q3-sales.csv file chip above a spreadsheet preview linked by a thin arrow to a grouped bar chart comparing target and actual values by region.

Start from the file you already have

Most requests start as a sales export, a survey dump, or a table pasted into an email. Upload the file or paste the rows, say what the reader needs to see, and the first draft comes back as a labelled chart instead of an empty canvas. If the figures are trapped in a PDF, PDF Summarizer can pull the numbers out first, then you chart the cleaned table.
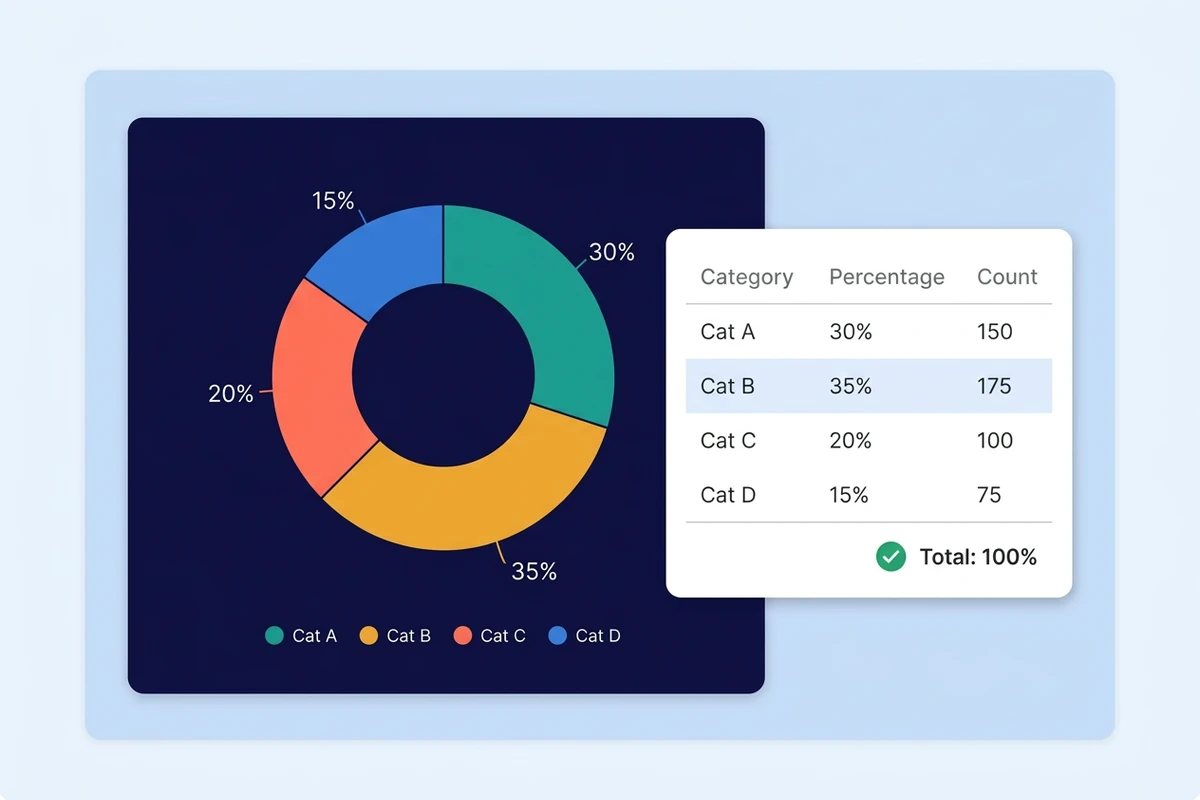
A dark navy card holding a four-part donut chart beside a white card listing the same totals, with one row highlighted and a green check mark.

Check the totals before the chart ships

A chart can look right and still not reconcile. Keep the source rows beside the result and run three checks: do the totals match the table, does the axis start where it should, and does the title name the unit and the period. When figures arrive from a warehouse instead of a file, the SQL to report workflow keeps the query and the write-up together.

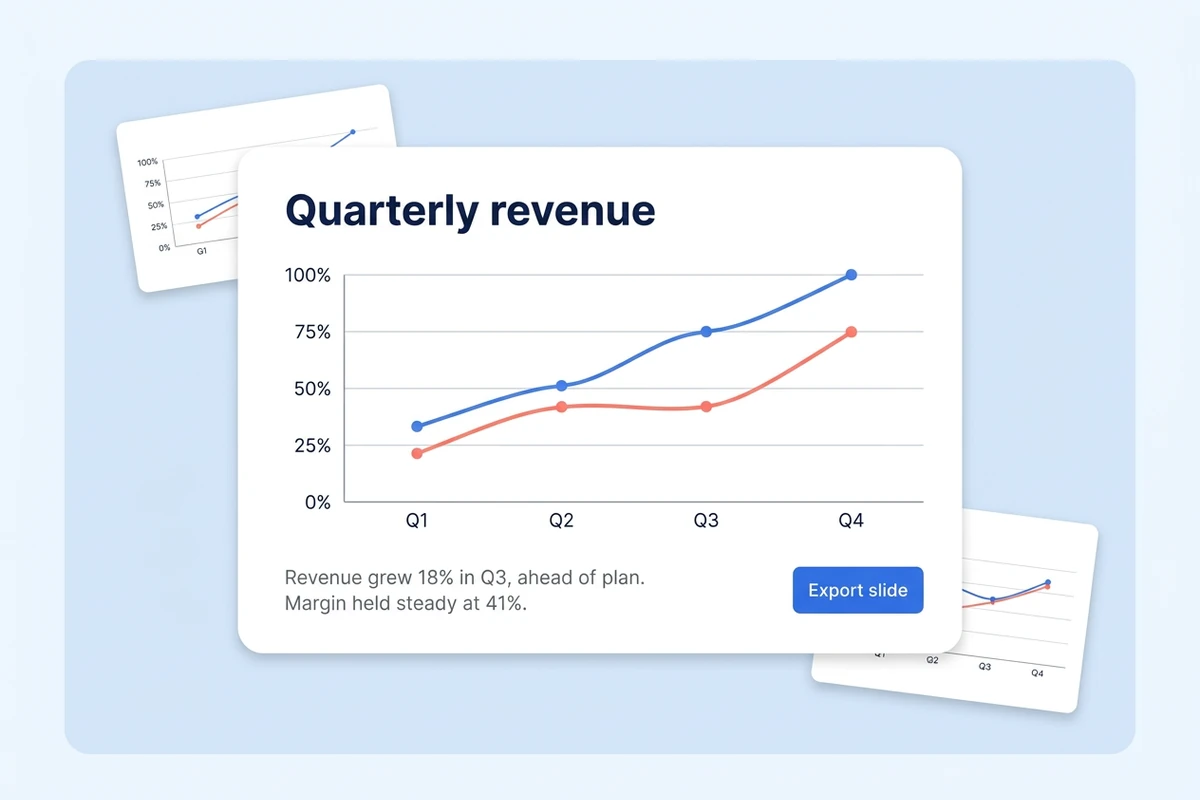
A slide card showing a Quarterly revenue line chart and a two-line takeaway above an Export slide button, with two smaller thumbnails behind it.

Carry the chart into the update

A chart usually exists for a slide, a weekly update, or a report section. Ask for the takeaway in the same pass, the sentence that says what moved and why it matters, then take both into the document. The picture and its reading arrive together instead of being rewritten by hand the night before.

What you can do with Ottermind

Weekly KPI update for your manager

Turn a metrics export into a trend chart that shows which week changed, with the totals still visible so the manager can check the number before forwarding it.

Board chart for a founder

Chart revenue against burn from the finance sheet, then write the one-line takeaway that sits beside it in a board deck and answers the first question investors ask.

Survey results for a teacher or researcher

Chart response counts by answer option, keep the counts next to the bars, and flag the group that answered differently from the rest before the results go into a class or paper.

Channel comparison for a marketer

Put spend and conversions by channel in one view, then move the chart and its reading into the next update instead of rebuilding it every Monday. How to Schedule Weekly Project Reports with Ottermind covers the recurring side.

How to make a graph with AI

Move from a raw table to a chart you can defend in three steps, with the checking step kept inside the workflow.

1

Upload a CSV, an Excel sheet, or a pasted table, then name the comparison, the audience, and the period the chart covers. A vague brief is what produces a pretty chart nobody needed.

2

Ask for the chart the comparison needs: bars to rank categories, lines for change over time, a single donut only when the parts add up to one whole. Check that the axes come back labelled with units.

3

Compare the chart against the source rows, fix a missing unit or a misleading baseline, then move the chart and its one-line takeaway into the deck or report it was made for.

Build a chart in Studio

Why creators choose Ottermind

An agent workspace keeps the data, the chart, and the writing that surrounds it close enough to check each other.

Data stays in the project

The file you uploaded, the chart built from it, and the update around it sit in one place, so you can compare the picture with the rows before it ships.

One job, connected steps

Reading the rows, choosing the chart, and writing the takeaway can run as linked steps rather than three separate prompts you have to re-explain.

Adjust by asking

Ask for a different chart type, shorter labels, or a second series in plain language, then compare the revision against the version before it.

Takeaway written with it

The chart arrives with a sentence you can say out loud, and Executive Summary Generator can tighten the update around it.

Visible work, your approval

Agent steps stay visible as they run, and the actions that matter, such as sending or publishing, remain subject to your approval.

Reusable on the next cycle

A weekly or monthly chart keeps its brief and label conventions with the project, so the next period starts from the last one instead of from scratch.

Frequently asked questions

How does an AI graph generator turn my data into a chart?

You upload a spreadsheet, CSV, or pasted table and describe the comparison you need. The agent reads the rows, drafts a chart with labelled axes, and writes a short takeaway that you can check against the source data before using it.

Can it build a chart from an Excel or CSV file?

Start with the file you already have, or paste the rows straight into the request. If the figures come from a survey, Market Research Tool can collect and organize the responses first; if they sit in a PDF, extract them before charting.

Which chart type should I choose?

Match the chart to the comparison: bars for ranking categories, lines for change over time, stacked bars for parts of a total, and a donut only when the pieces add up to one whole. Flowcharts, mind maps, and function plots are a different job from a data chart.

Will the generated chart be accurate?

Treat it as a draft and check it. Keep the source rows in reach, confirm the totals reconcile, make sure the axis starts where it should, and check that the title names both the unit and the period.

Can I use the chart in a slide deck or report?

Yes. Ask for the chart and its takeaway in the same request, then move both into the deck or the report section so the picture and the sentence arrive together rather than being matched up later.

Can I try it without an account?

The public experience can be used without signing in for a limited number of free rounds. Account-based credits and advanced options may still apply once the workflow moves into production work you intend to share.

Discover more image AI tools

More on getting images right

Turn your data into a chart you trust

Bring the spreadsheet and the question. Draft the chart, write the takeaway, and check the totals against the rows before it goes into the update.

Build a chart in Studio