Buyer's Guide
Best AI Observability Tools: How to Choose for Agents and LLM Workflows
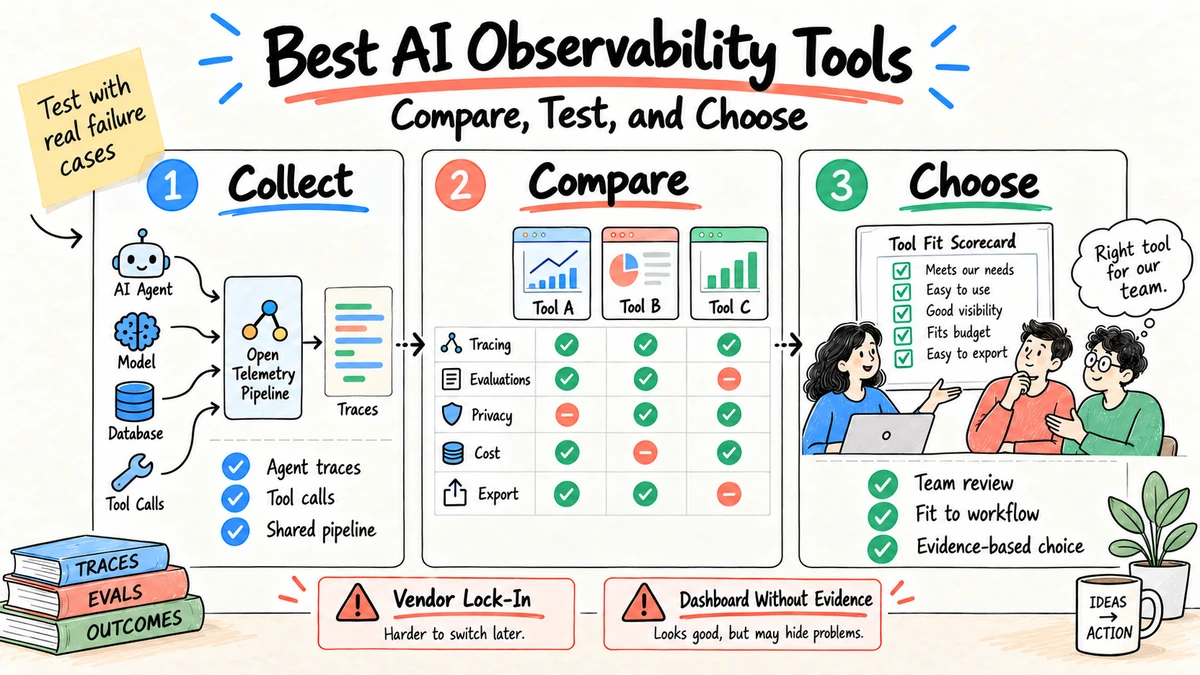
The best AI observability tool is the one that connects a production failure to the exact run, prompt or model version, retrieval result, tool call, evaluation, and user outcome. Choose from requirements, not the longest feature list. Most teams need interoperable traces, task-specific evaluations, privacy controls, and an export path more than they need another generic dashboard.
Research and disclosure: This buyer's guide uses public documentation from OpenTelemetry, LangSmith, Arize Phoenix, Braintrust, and Datadog, reviewed September 4, 2026. Ottermind is not ranked as an observability vendor. Features and plans change; verify them with a representative trial.
Shortlist by operating need
| Need | Tools to evaluate | Why they enter the shortlist |
|---|---|---|
| Open telemetry and local inspection | OpenTelemetry plus Arize Phoenix | Open instrumentation and a path to inspect traces and evaluations |
| LangChain or LangGraph development | LangSmith | Tight tracing, dataset, and evaluation workflow for that ecosystem |
| Evaluation-first product iteration | Braintrust | Experiments, scorers, datasets, and production logs in one loop |
| Existing enterprise monitoring | Datadog LLM Observability | Agent signals alongside application infrastructure and incidents |
| Vendor-neutral data pipeline | OpenTelemetry collector plus chosen backend | Portable event conventions and control over routing |
This is a shortlist by fit, not a universal ranking. Add security, data residency, retention, deployment, and price requirements before selecting a product.
Seven capabilities to test
1. End-to-end traces
The trace should connect model calls, retrieval, tool use, subagents, retries, and approval steps. Check whether asynchronous work and handoffs remain part of the same run.
2. Versioned experiments
You need to compare prompt, model, tool, and retrieval changes on the same dataset. A chart without version metadata cannot explain a regression.
3. Online and offline evaluation
Look for deterministic checks, model-based graders, human review, and custom business outcomes. Confirm that you can inspect individual failures behind an aggregate score.
4. Cost and latency attribution
The product should attribute tokens, cost, and time to steps and tools, not only the final request. Otherwise one retry loop can hide inside an acceptable average.
5. Privacy controls
Test redaction before export, role-based access, content-free tracing, retention controls, and audit logs. Ask whether prompts and outputs are used for vendor training.
6. Open export
Confirm you can send or export telemetry using a documented format. OpenTelemetry compatibility reduces the cost of changing backends and connecting agent traces with application monitoring.
7. Operational workflow
The useful endpoint is a fix: alert, inspect, label, add a failing case to a dataset, test a change, and verify the production result. Make sure the tool supports that loop without spreadsheet archaeology.
Understand the product categories
Open instrumentation standards
OpenTelemetry is not a finished observability product by itself. It provides APIs, SDKs, collectors, and semantic conventions that help applications describe and route telemetry consistently. It belongs in the shortlist when portability, existing monitoring infrastructure, or control over data routing matters.
Test the maturity of the exact language, model provider, and agent framework instrumentation you use. Compatibility on a vendor page does not prove that tool calls, streaming, retrieval, handoffs, and errors appear with the fields your team needs.
Agent development platforms
Platforms such as LangSmith connect traces with prompt or workflow development, datasets, experiments, evaluators, and annotation. They can shorten the distance from a failed production run to a regression test, especially when the team already uses related frameworks.
The evaluation should still include a framework-neutral application. Confirm what works through native integration, what requires manual instrumentation, and how data can be exported.
Evaluation-first platforms
Products such as Braintrust emphasize datasets, scorers, experiments, logs, and comparisons. They fit teams that treat evaluation as the release contract rather than an occasional dashboard.
Test complex multi-step traces, human annotation, production sampling, and the path from a reviewer correction to a permanent test case. Ask how evaluator versions and judge-model changes affect historical comparisons.
Open-source inspection and experimentation
Projects such as Arize Phoenix can support local or self-managed trace inspection and evaluation. Open source gives teams deployment and customization options, but they own upgrades, storage, authentication, backup, availability, and incident response unless a managed service covers them.
Run the same security review you would apply to a commercial service. Self-hosting changes responsibility; it does not remove it.
Enterprise application monitoring
Platforms such as Datadog connect AI signals with application traces, infrastructure, logs, service ownership, and on-call workflows. This can be decisive when an agent failure crosses model calls, APIs, databases, queues, and network dependencies.
Verify the depth of agent-specific evaluation and dataset workflows. Strong infrastructure correlation does not automatically provide the editorial or domain-quality loop a product team needs.
Match the tool to the team
| Team situation | Start with | Validate before committing |
|---|---|---|
| Small team, one agent prototype | Native tracing or lightweight open tool | Debug speed and minimal setup overhead |
| Product team shipping weekly | Tracing plus versioned experiments and datasets | Regression workflow and reviewer labeling |
| Multiple frameworks and providers | OpenTelemetry-compatible instrumentation | Consistent fields and backend portability |
| Regulated or sensitive workloads | Self-managed or strongly controlled service | Redaction, residency, access, retention, audit |
| Existing enterprise observability program | Current APM plus agent-specific extension | Quality evaluation depth and trace correlation |
| Research or evaluation group | Evaluation-first platform | Reproducibility, custom scorers, dataset governance |
Avoid treating organization size as the only signal. A small legal workflow may need stricter capture controls than a high-volume public demo, while a large internal prototype may need little production infrastructure.
Five selection scenarios
Scenario 1: A support agent gives an incorrect policy answer
Prioritize multi-turn threads, retrieval traces, document-version metadata, citation evaluation, annotation, and a fast path from a user correction to a regression case. Infrastructure metrics alone will not show why the outdated policy won.
Scenario 2: A coding agent consumes unpredictable time and tokens
Prioritize nested tool and model spans, retry and loop visibility, token and cost attribution, sandbox events, and route comparison across versions. Test a run that times out after changing files, not only a successful code suggestion.
Scenario 3: A regulated document workflow
Prioritize content-free tracing, redaction before export, self-managed or region-controlled storage, role-based access, audit logs, retention, and deterministic validations. A lower-cost tool is not a fit if reviewers cannot prove which source and version governed the result.
Scenario 4: A product team compares prompts and models weekly
Prioritize datasets, experiments, evaluator versioning, side-by-side output review, statistical summaries, and production feedback. The team needs reproducibility and change comparison more than a mature on-call interface.
Scenario 5: Many teams use different agent frameworks
Prioritize OpenTelemetry compatibility, a common event schema, collector control, framework-neutral tracing, and export. Test semantic consistency across two frameworks; merely accepting OTLP does not guarantee comparable agent spans.
Use a weighted decision matrix
Set weights before trials. The following example suits a production knowledge-work agent; adapt it to the actual risk.
| Criterion | Weight | Candidate A | Candidate B | Candidate C |
|---|---|---|---|---|
| Trace completeness | 20 | |||
| Evaluation workflow | 15 | |||
| Privacy and access | 20 | |||
| Debug and review usability | 15 | |||
| Integration and portability | 10 | |||
| Production operations | 10 | |||
| Total cost | 10 |
Score each from 0 to 5 using evidence from the proof of concept. Add a separate pass/fail list for nonnegotiable requirements such as region, deletion, SSO, or content suppression. A high weighted score must not override a failed legal or security requirement.
Require a note and test run behind every score. Otherwise the matrix turns demo impressions into decimals.
Test reviewer usability
Observability serves more than engineers. Ask a product manager, domain specialist, security reviewer, and support operator to investigate the same labeled runs without coaching.
Observe whether they can:
- find the run from a user report or artifact ID;
- understand the sequence without reading raw JSON;
- open the exact retrieved source and tool result;
- distinguish production input from evaluator commentary;
- label the failure and assign an owner;
- compare the failing version with a candidate fix;
- export evidence for an incident or audit;
- avoid seeing content outside their authorization.
Record completion time and mistakes. A platform that is powerful for its implementer but unusable for the reviewers who judge quality will leave the improvement loop incomplete.
Evaluate alerting and incident response
Create three test incidents: a tool outage, a sudden cost increase, and an output-quality regression. Confirm how the platform groups affected runs, suppresses duplicates, links changes, routes notifications, and preserves evidence.
Quality alerts need enough volume and calibration to avoid noise. A single low model-judge score may create a review item; a sustained fall in accepted completion may justify an incident. Security and privacy events can require immediate response from one confirmed case.
Check whether alerts can use business outcomes such as rejected deliverables or unresolved support cases, not only technical telemetry. The most important production failure may return HTTP 200.
Plan the instrumentation architecture
Agent application
  -> in-process instrumentation and redaction
  -> OpenTelemetry or vendor SDK
  -> controlled collector or gateway
  -> routing and sampling policy
  -> observability backend
  -> evaluation and annotation
  -> incident, issue, and deployment systems
Put secret filtering and mandatory classification as close to the application as practical. Use a collector or gateway to apply routing, sampling, enrichment, and destination controls consistently. Keep workflow and release metadata connected to deployment records so a change can be investigated.
Document failure behavior. If the observability backend is unavailable, decide whether telemetry buffers, drops, or blocks the workflow. Most user-facing agents should not fail solely because optional tracing is down, but high-risk workflows may require a durable audit record before a consequential action proceeds.
Avoid benchmark traps
Vendor comparisons often count integrations or present synthetic latency. Those signals do not answer whether your team can resolve its failures. Use the same agent version, test cases, sampling, content-capture mode, retention, and evaluator definitions for every candidate.
Do not compare a locally hosted open-source tool with a managed service while excluding internal infrastructure and labor. Do not compare list price when candidates count spans, tokens, storage, evaluations, and seats differently. Normalize to cost per accepted workflow outcome under the same volume assumptions.
Keep the original raw test outputs and scoring notes. If a candidate improves during the trial, record the version and rerun the fixed test instead of editing the old score from memory.
Write requirements from failures
Turn concrete debugging stories into acceptance tests:
Failure: The agent cited an outdated policy after a three-turn conversation.
Required evidence:
- Complete conversation thread and run IDs
- Retrieval query and returned document versions
- Prompt, model, and workflow versions
- Tool and fallback sequence
- Citation evaluator result
- Final user correction and outcome

Acceptance test:
A reviewer can find the outdated retrieval, add the run to a dataset,
compare a proposed fix, and confirm the corrected production version.
Create at least five stories: wrong answer, expensive loop, slow dependency, permission failure, and privacy-sensitive trace. A vendor demonstration should reproduce these stories with your data shape rather than present a prepared dashboard.
A two-week proof-of-concept scorecard
Test two real workflows and score every criterion from 0 to 2.
| Criterion | 0 | 1 | 2 |
|---|---|---|---|
| Trace completeness | Major steps missing | Most steps visible | Full run is reconstructable |
| Evaluation fit | Fixed generic scores | Some custom logic | Task-specific and versioned |
| Debug time | No improvement | Partial improvement | Root cause found quickly |
| Privacy | Content always stored | Manual controls | Policy-driven minimization |
| Portability | Closed export | Partial export | Open, documented export |
| Outcome link | No user outcome | Manual labels | Outcome joins to each run |
Workflow:
Failure to reproduce:
Required trace fields:
Sensitive fields to suppress:
Offline evaluation set:
Production outcome:
Alert threshold:
Reviewer:
Exit decision: adopt / extend test / reject
A day-by-day proof of concept
Days 1-2: Freeze the test
Choose two workflows, ten known-good runs, ten failures, and one sensitive case. Document current debugging time, cost, latency, and acceptance rate. Finalize the scoring rubric before vendors configure the product.
Days 3-4: Instrument
Connect the staging workflow. Record the fields that appear automatically, the code changes required, missing spans, and setup time. Verify streaming, retries, background jobs, and tool errors rather than stopping after one successful chat.
Days 5-6: Evaluate
Import or create a dataset, add deterministic and qualitative evaluators, and compare two controlled workflow versions. Have a domain reviewer label failures without relying on the vendor's default score.
Days 7-8: Test operations
Create an alert, investigate it, assign a correction, add the run to regression, and verify a fixed version. Export trace and evaluation data. Test role changes and removal of a user's access.
Days 9-10: Test governance and cost
Exercise redaction, retention, deletion, audit logs, and content-free capture. Estimate monthly ingestion, storage, evaluation, seats, support, and engineering operation. Record assumptions and volume bands.
End with a written decision. A polished proof of concept can still fail because export is incomplete, reviewers cannot use it, or projected evaluation cost is too high.
Estimate total cost of ownership
Include more than the subscription price:
| Cost area | Questions |
|---|---|
| Ingestion | Are spans, tokens, events, or bytes billed? What is sampled? |
| Retention | How do hot, archived, and deleted traces affect cost? |
| Evaluation | Are judge-model calls included or passed through? |
| Seats | Which engineers, reviewers, auditors, and viewers need access? |
| Hosting | For self-managed tools, who owns compute, storage, backup, and upgrades? |
| Engineering | How much custom instrumentation and maintenance is required? |
| Migration | Can historical traces, datasets, labels, and evaluators be exported? |
| Incident response | Does support coverage match production risk and time zones? |
Model three volumes: current, expected twelve-month usage, and a spike. Sampling and retention should be explicit in each model. Cheap ingestion can become expensive when full prompts, outputs, and judge evaluations multiply every run.
Security and privacy review
Ask the vendor to demonstrate, not merely describe:
- redaction before data leaves your application;
- metadata-only tracing by workflow classification;
- encryption in transit and at rest;
- regional processing and storage choices;
- tenant isolation and role-based access;
- audit logs for viewing and export;
- configurable retention and verified deletion;
- treatment of prompts, outputs, and telemetry for model training;
- subprocessors and support access;
- secret detection in tool arguments and error messages.
Create a test trace containing synthetic credentials and personal data, then confirm the expected block or redaction at every destination. Never use real secrets for this test.
Build, buy, or combine
Buy a managed platform when speed, collaboration, hosted evaluation, and support matter more than maximum infrastructure control.
Self-manage an open-source stack when data control, customization, or integration with internal infrastructure justifies ongoing operational ownership.
Extend existing APM when cross-service incidents and established on-call practices dominate, provided agent-quality evaluation can be added.
Combine open instrumentation with a chosen backend when portability is a requirement. This is often a practical middle path, but only if the common schema retains the details needed by the backend.
Avoid building an entire interface merely to avoid a license. Custom instrumentation and a small internal quality report may be reasonable; recreating trace search, evaluation, annotation, access control, and retention is a product commitment.
Migration and exit checklist
[ ] Trace data exports in a documented, usable format.
[ ] Datasets preserve inputs, expected outputs, metadata, and splits.
[ ] Human labels and reviewer identities can be retained under policy.
[ ] Evaluator definitions and versions can be recreated elsewhere.
[ ] Prompt and workflow version references remain meaningful.
[ ] Alerts, dashboards, and saved queries are inventoried.
[ ] SDK removal does not break the production workflow.
[ ] Deletion from the former service can be verified.
Run one export during the trial. Contract language is not a substitute for seeing whether the resulting data can rebuild a useful investigation.
Adoption after purchase
Start with shared naming, required attributes, capture modes, and workflow outcome fields. Publish an instrumentation example and review it like an API contract. If every team invents its own agent_name, status, and user outcome, the central tool cannot create comparable views.
Create owners for instrumentation, platform operation, evaluation, domain review, privacy, and incident response. Hold a monthly failure review that selects a small number of changes and verifies their production effect. More traces without an operating cadence create storage, not reliability.
Audit saved dashboards and alerts after each major workflow change. Retire metrics that no longer lead to a decision, and test that new tools or handoffs appear in traces before rollout.
Questions for an RFP or vendor call
- Which agent frameworks, model providers, and languages are supported at step level?
- How are multi-turn threads, subagents, asynchronous work, and handoffs represented?
- Which OpenTelemetry conventions and export paths are supported today?
- Can we run custom deterministic, model-based, and human evaluations?
- How are datasets, evaluators, prompts, and workflow versions connected?
- Where does redaction occur, and can content capture be disabled by policy?
- What are default and maximum retention periods?
- How are access, support viewing, and exports audited?
- What happens to our data during model training and service improvement?
- How is pricing affected by spans, storage, evaluations, and seats?
- What can be exported if we leave, and in which format?
- Which current limitations would affect our proof-of-concept failures?
Common selection mistakes
- Buying for attractive dashboards before defining a debugging question.
- Treating generic sentiment or relevance as proof of task success.
- Capturing full content by default and designing privacy later.
- Comparing tools with toy chat prompts instead of multi-step failures.
- Locking instrumentation to one backend without testing export.
- Measuring request success while ignoring whether users accept the work.
Another common mistake is selecting from a comparison table without confirming the publication date. Agent observability products evolve quickly. Treat this guide as a requirements framework, then verify every capability in current documentation and in the trial environment.
The companion AI agent observability guide defines the event and review model. The agentic workflow explainer helps identify which steps and human decisions belong in a trace.
FAQ
Are LLM observability and AI agent observability the same?
They overlap, but agent observability covers more than model calls. It must include planning, retrieval, tools, state, handoffs, retries, permissions, approvals, and final outcomes.
Is an open-source tool always cheaper?
No. License cost is only one component. Include hosting, storage, maintenance, access control, on-call integration, and the engineering time required to keep instrumentation current.
Can standard application monitoring handle agents?
It can cover infrastructure and service health. It usually needs agent-specific traces and evaluations to explain behavioral failures and task quality.
How many tools should we trial?
Two or three is enough when the scorecard and representative failures are fixed in advance. A broad tour produces screenshots, not a decision.
Do we need both tracing and evaluation?
Yes for most production agents. Tracing explains the sequence; evaluation judges whether the result and behavior met the task contract. Either one alone leaves an important gap.
Should observability data stay in the same region as production data?
That depends on applicable policy, contracts, and data classification. Treat telemetry as potentially sensitive production data and verify processing, storage, support access, and transfer requirements.
What should we export during a trial?
Export representative traces, datasets, human labels, evaluation results, and configuration definitions. Confirm that another engineer can understand and reuse them without the original interface.
Which AI observability tool is best for a startup?
There is no automatic startup winner. Begin with the lightest option that reconstructs the real workflow and supports a failure-to-test loop. Avoid an enterprise platform whose operation exceeds the agent's complexity, but preserve an export path.
Can we switch observability backends later?
Open instrumentation helps, but dashboards, evaluator definitions, annotation, datasets, alerts, and proprietary fields can still create lock-in. Test export and recreation during the proof of concept.
Should evaluation run on every production trace?
Not necessarily. Use deterministic checks broadly when inexpensive, sample model-based and human evaluation by risk and volume, and always review confirmed high-impact incidents under policy.
Start the evaluation with a real Ottermind workflow and preserve its source pack, accepted deliverable, and reviewer corrections as the shared test case.