Guide
AI Agent Observability: A Practical Guide to Traces, Metrics, and Reviews
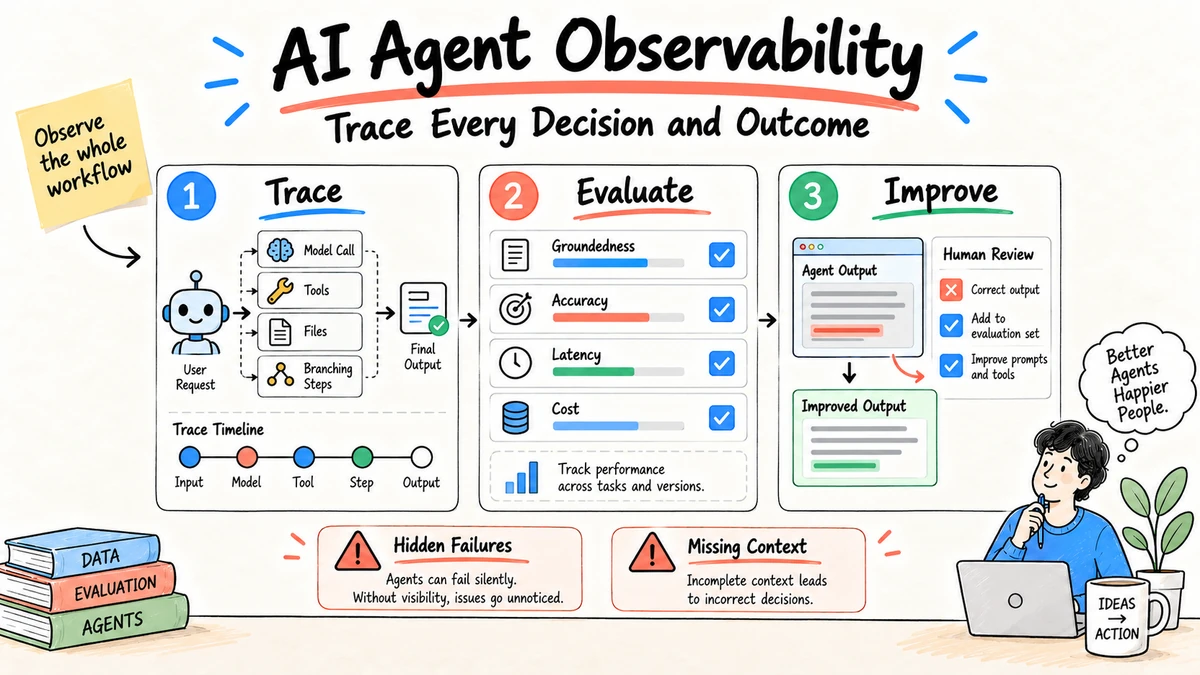
AI agent observability is the ability to reconstruct what an agent tried, which tools and data it used, what each step returned, how much the run cost, and whether the final result was acceptable. A dashboard that shows only latency and errors is not enough. Agent behavior is variable, so teams also need traces, evaluations, business outcomes, and a review path for sensitive content.
Research and disclosure: This guide reflects OpenTelemetry's agent observability work, OpenTelemetry semantic conventions, and the NIST AI Risk Management Framework, reviewed September 4, 2026. The operating model below is an original editorial framework, not an Ottermind performance benchmark.
What agent observability must answer
A useful system should answer six questions without asking an engineer to reconstruct the run from unrelated logs:
- What goal, instructions, model, and inputs started the run?
- Which model calls, retrievals, tools, and approvals occurred?
- What did each step receive and return?
- Where did the run retry, stall, branch, or fail?
- Did the result meet a task-specific quality threshold?
- Can a reviewer reproduce the evidence without exposing restricted data?
Traditional application monitoring still matters. Availability, latency, and error rates tell you whether the service works. Agent observability adds the task-level context needed to tell whether the service did the right work.
The four-layer observability model
| Layer | Capture | Question answered |
|---|---|---|
| Run | Goal, version, model, user, environment, final status | What happened overall? |
| Trace | Model calls, tool calls, handoffs, retries, approvals | How did the agent get there? |
| Evaluation | Groundedness, completeness, policy, format, human score | Was the result good enough? |
| Outcome | Acceptance, correction time, completion, business impact | Did the work help? |
Do not collapse these layers into one score. A fast run can produce a bad report. A grounded report can still arrive too late. An accepted deliverable can still expose data that should never have entered a trace.
A minimum event schema
Start with a small event contract that every agent and tool can emit:
{
  "run_id": "run_123",
  "step_id": "step_07",
  "parent_step_id": "step_03",
  "operation": "tool.call",
  "tool": "document_search",
  "started_at": "2026-09-04T09:00:00Z",
  "duration_ms": 842,
  "status": "ok",
  "input_classification": "confidential",
  "content_recorded": false,
  "tokens": 0,
  "cost_usd": 0,
  "evaluation_refs": ["eval_19"]
}
Stable run and parent identifiers make the sequence reconstructable. Record versions for prompts, models, tools, and policies so a regression can be tied to a change. Keep raw prompts and outputs optional: metadata is often enough for operational analysis, while content capture creates privacy and retention obligations.
Keep four identifiers distinct
workflow_idnames the durable product or business process.workflow_versionidentifies the tested configuration of prompts, tools, models, and rules.run_idconnects every step in one execution.thread_idlinks related runs across a conversation or longer task.
Do not reuse a user ID as a thread or run ID. Keep identity in a separately controlled field and use pseudonymous references where analysis does not require direct identification. Attach the artifact or business-record ID only when policy permits it.
Add deployment, environment, experiment, and source-set versions. These dimensions answer whether a failure began after a release, affects one cohort, or depends on a stale knowledge collection.
Metrics that reveal agent behavior
Track a compact set before adding dozens of charts:
- completion and abandonment rates by task type;
- median and tail latency for the run and each tool;
- tool failure, retry, and fallback rates;
- steps, tokens, and cost per accepted result;
- groundedness or citation coverage where evidence matters;
- human correction time and rejection reasons;
- policy blocks, approval requests, and permission denials.
Segment metrics by workflow version and representative task. Aggregate averages can hide that one document type or one tool integration fails repeatedly.
Follow one run from goal to outcome
Consider a research agent asked to prepare a competitor brief from ten approved sources. The final document contains the wrong price for one competitor. A useful trace should let the reviewer move backward through the run:
- The outcome record shows that the brief was rejected and labels the pricing error.
- The final synthesis span identifies which extracted pricing row supplied the sentence.
- The retrieval span shows that an archived help article ranked above the current pricing page.
- The source metadata shows no effective-date field and no rule that preferred current official pages.
- The workflow version shows that a recent retrieval change removed a date filter.
The corrective action is not simply "use a better model." Restore the source-priority rule, add the rejected run to an evaluation set, test other time-sensitive claims, and monitor retrieval from archived pages. Observability creates value when it connects a visible defect to a change that can be tested.
Without a linked trace, the team may edit the single price, retry the task, or modify the prompt without knowing whether the underlying retrieval failure remains.
Design spans around decisions
A trace becomes unreadable when every helper function is a span and incomplete when the entire run is one span. Instrument meaningful units of work:
- goal intake and policy classification;
- plan creation or route selection;
- each model invocation;
- each retrieval query and returned source set;
- every external tool call and result;
- state or memory reads and writes;
- retry, fallback, and stop decisions;
- human approval requests and responses;
- artifact creation and validation;
- final delivery and user outcome.
Use parent-child relationships for nested work and links for asynchronous tasks that share a cause but not a direct call stack. Give every span a stable operation name. Put variable values such as tool name, workflow version, and document class in attributes so they can be filtered without creating thousands of metric names.
Record enough context, not hidden reasoning
The goal is to capture observable inputs, outputs, decisions, and state transitions. Do not depend on private chain-of-thought or verbose internal reasoning. A route field such as selected_tool=document_search, plus the allowed alternatives and tool result, is more useful and governable than an unrestricted reasoning transcript.
For a failed decision, record the policy or evaluator that should have governed it, the evidence available at that point, and the resulting action. This supports debugging without turning every trace into a sensitive narrative.
Build evaluations from real failure modes
Generic metrics such as fluency and helpfulness are rarely enough. Define evaluation dimensions from the workflow contract.
For the research brief, useful dimensions might include:
| Dimension | Deterministic check | Human or model-assisted check |
|---|---|---|
| Source coverage | Every required source ID appears | Sources are used in the right context |
| Citation validity | Links and document locations resolve | Passage supports the nearby claim |
| Freshness | Current claims have acceptable dates | Older context is appropriately qualified |
| Completeness | Required sections and competitors exist | Decision-relevant gaps are surfaced |
| Constraint adherence | Word limit, format, and prohibited actions | Tone and prioritization fit the audience |
| Outcome | Delivery occurred and artifact opens | Reviewer accepts with limited correction |
Use three evaluation stages:
- Pre-release regression: fixed cases run before a workflow version ships.
- Production sampling: a defined percentage of real runs receives automated or human review.
- Failure promotion: rejected, corrected, or unusual runs become labeled regression cases.
Keep evaluation prompts, grading models, rubrics, and datasets versioned. When the judge changes, do not compare its scores with an old baseline as if the measurement stayed constant.
Define service objectives for the workflow
Application uptime does not describe whether an agent finishes useful work. Add task-level service indicators:
- percentage of eligible runs that produce an artifact;
- percentage accepted without material correction;
- time from request to review-ready result;
- percentage escalated to the correct owner;
- maximum cost for an accepted result;
- citation or evidence coverage for source-backed work;
- policy-compliant completion rate.
Create objectives by workflow class. A five-minute research memo and a ten-second support answer should not share one latency target. Exclude invalid inputs only through a documented rule, or teams can make reliability look better by reclassifying difficult failures.
Alert on symptoms people can act on
Avoid paging someone for every low evaluation score. Alerts should identify a bounded operational response.
| Signal | Possible threshold | First response |
|---|---|---|
| Tool error rate | Above baseline for 10 minutes | Check dependency and fallback behavior |
| Retry depth | Repeated loops beyond allowed steps | Stop affected runs and inspect route logic |
| Cost per accepted task | Budget exceeded by workflow version | Compare model, context, and retry changes |
| Citation failures | Any critical claim or rising sample rate | Hold publication and inspect retrieval |
| Permission denials | Sudden increase by tool or user role | Check identity and rollout configuration |
| Safety or privacy event | One confirmed high-impact event | Activate incident process immediately |
Use dashboards for trends, tickets for defects, and pages for urgent incidents. If every evaluation fluctuation wakes an operator, alert fatigue will hide the event that actually needs intervention.
Choose a sampling strategy
Full metadata capture may be inexpensive enough for every run, while full content retention and model-based evaluation are not. Combine sampling rules:
- random sampling estimates normal quality without selecting only dramatic failures;
- risk sampling reviews more runs from consequential workflows;
- event sampling retains errors, policy blocks, costly loops, and user rejections;
- change sampling increases coverage after a model, prompt, retrieval, or tool release;
- segment sampling ensures rare languages, document types, user roles, and edge cases appear;
- trace-consistent sampling keeps the complete multi-step run rather than disconnected spans.
Document the denominator. If a dashboard shows a 95% pass rate from only successful completed runs, abandoned and blocked work has disappeared from the measurement.
Review the sample for blind spots. A rule that keeps only slow or failed runs cannot estimate everyday quality, while pure random sampling may miss rare high-impact incidents. Preserve confirmed incidents independently of routine sampling under the relevant records policy.
Reconcile telemetry with user feedback
Connect explicit rejection, correction, retry, escalation, support ticket, and accepted artifact signals to the run. Do not infer satisfaction from a user ending the conversation; they may have abandoned it.
Create structured feedback reasons such as wrong source, missing requirement, stale information, unsafe action, poor format, too slow, or too expensive. Keep optional free text for context, but avoid making every analysis depend on manual reading.
When feedback contradicts an automated evaluator, inspect the case. The user may be wrong, the evaluator may be poorly specified, or the workflow may optimize a technical rubric that does not match the real outcome. These disagreements are valuable evaluation cases.
Run an agent incident review
An incident review should be blameless and traceable:
User impact and affected runs:
Detection time and signal:
Workflow, prompt, model, tool, and policy versions:
Expected behavior:
Observed sequence:
Source, state, or permission involved:
Why existing evaluations did not catch it:
Immediate containment:
Corrective change and owner:
Regression cases added:
Monitoring change:
Follow-up date:
Separate the triggering error from systemic contributors. A model may emit an invalid argument, but the tool contract may also accept it, the retry loop may repeat it, and the evaluation may ignore tool outcomes. Fixing only the first visible failure leaves the system fragile.
Roll out observability in four stages
Stage 1: Reconstruct a single run
Instrument one bounded workflow end to end. Confirm that an engineer and a domain reviewer can independently explain a failed run from the trace.
Stage 2: Connect quality
Attach deterministic validations, reviewer labels, and accepted or rejected outcomes. Build a small regression set from observed failures.
Stage 3: Operate at production volume
Define sampling, retention, redaction, dashboards, and actionable alerts. Measure telemetry cost and verify that tracing does not expose restricted data.
Stage 4: Improve systematically
Use failure clusters to prioritize changes, compare versions on fixed datasets, and confirm the effect in production. Review stale metrics and remove telemetry that no longer drives a decision.
A weekly review template
Workflow and version:
Expected user outcome:
Representative successful runs:
Representative failed or corrected runs:
Top failure modes:
Changes since the prior review:
Latency and cost shift:
Evaluation shift:
Privacy or permission incidents:
One experiment for next week:
Owner and review date:
Sample failures, not only averages. Review at least one clean run, one expensive run, one rejected result, and one run that required human intervention. That set exposes behavior that a green status panel misses.
Privacy and security boundaries
Observability data can contain prompts, file names, retrieved passages, tool arguments, credentials, personal data, and business decisions. Classify it like production data. Redact secrets before export, separate content from metadata, restrict access, define retention, and log who inspected sensitive traces.
Create at least three capture modes. A metadata-only mode records timing, status, versions, classifications, and hashes. A redacted mode retains limited content after automated filtering. A restricted diagnostic mode captures approved content for a short period with named access. The workflow, not an individual developer, should select the mode from data classification.
Test redaction before telemetry leaves the process. A backend setting cannot protect a secret that was already transmitted. Also check derived data: document titles, tool arguments, embeddings, error messages, and evaluator explanations can reveal sensitive content even when the main prompt is removed.
A maturity checklist
[ ] Every production run has stable workflow and version identifiers.
[ ] Model, retrieval, tool, state, approval, and artifact steps are connected.
[ ] Sensitive-content capture follows a documented classification rule.
[ ] Accepted, corrected, rejected, and abandoned outcomes join to traces.
[ ] Evaluations reflect the task contract and are versioned.
[ ] Failed production runs can be promoted into regression datasets.
[ ] Alerts have an owner and a defined first response.
[ ] Retention, access, export, and deletion have been tested.
[ ] Cost includes telemetry storage and evaluation, not only model tokens.
[ ] A domain reviewer can reconstruct a result without engineering help.
For a broader threat model, use the AI agent security checklist. For component boundaries and orchestration contracts, see the AI agent architecture guide.
FAQ
What is the difference between AI agent monitoring and observability?
Monitoring reports known signals such as failures, latency, and cost. Observability gives enough connected evidence to investigate behavior you did not predict, including tool choices, retries, context, evaluations, and human corrections.
Should we store every prompt and response?
No. Store the least data needed for the operational and audit purpose. Prefer metadata and hashes when possible, redact secrets, limit content capture by task classification, and set a retention period.
Which metric should a new team start with?
Start with accepted completion rate and correction time for one bounded workflow. Add cost, latency, and failure-mode metrics around that outcome.
Does observability replace offline evaluation?
No. Offline evaluation tests known cases before release. Production observability shows how real inputs, tools, and users behave after release. Reliable teams use both.
How much production traffic should be sampled?
There is no universal percentage. Capture low-risk metadata broadly, then choose content and evaluation sampling based on volume, risk, cost, and failure frequency. Always retain confirmed incidents under the approved policy.
How long should traces be retained?
Retain them only as long as the debugging, evaluation, audit, or contractual purpose requires. Use shorter periods for raw content, longer periods for aggregated metrics, and documented holds for confirmed incidents.
Who should review agent traces?
Engineers review execution and integration failures; domain owners review task quality; security and privacy teams review relevant incidents. Role-based access should prevent broad browsing of sensitive content.
Can observability improve prompts by itself?
It supplies evidence, not an automatic fix. Use failure clusters to propose a change, test it on versioned cases, and confirm that gains do not create regressions elsewhere.
What is the first dashboard to build?
For one workflow, show eligible runs, accepted completion, rejection reasons, correction time, latency, cost, escalation, and the current workflow version. Link every aggregate to inspectable runs.
Is user feedback enough to measure quality?
No. Feedback is valuable but incomplete and self-selected. Combine it with task validations, representative sampling, domain review, and observed outcomes.
Should failed runs always be retained?
Retain the evidence required to investigate and meet policy, but still apply data minimization, access, and retention rules. A failure does not automatically justify indefinite storage of sensitive content.
Use Ottermind to run one bounded, source-backed workflow, review the resulting artifact, and record the corrections that should become your first evaluation set.