Presentation template
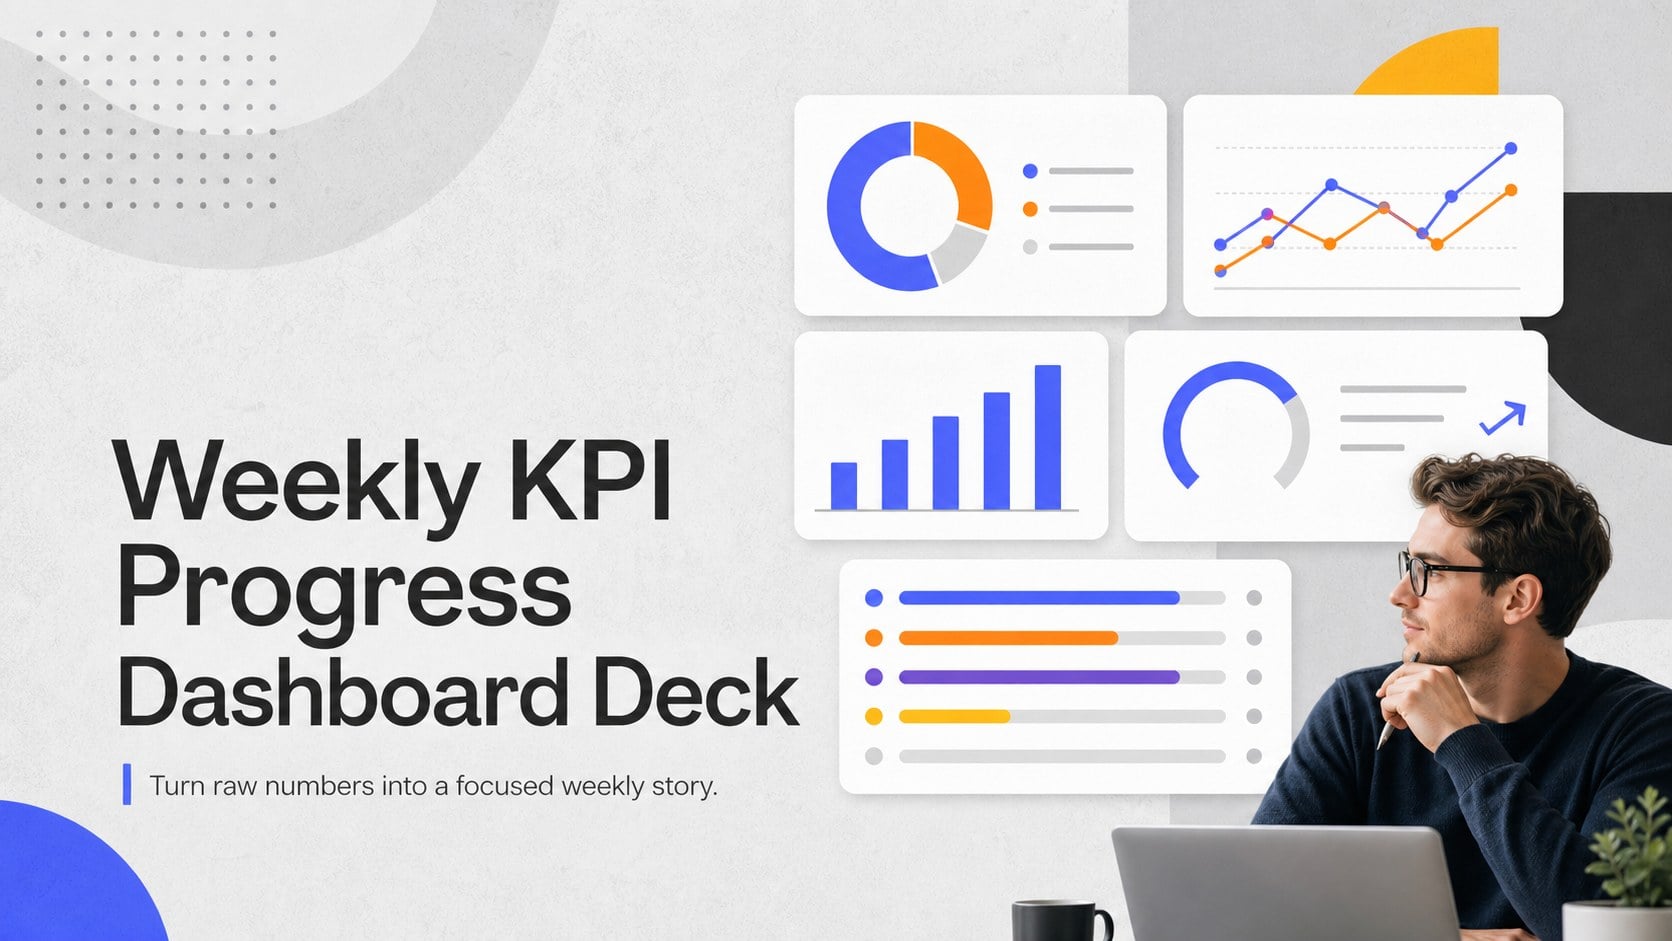
Weekly KPI Progress Dashboard Deck
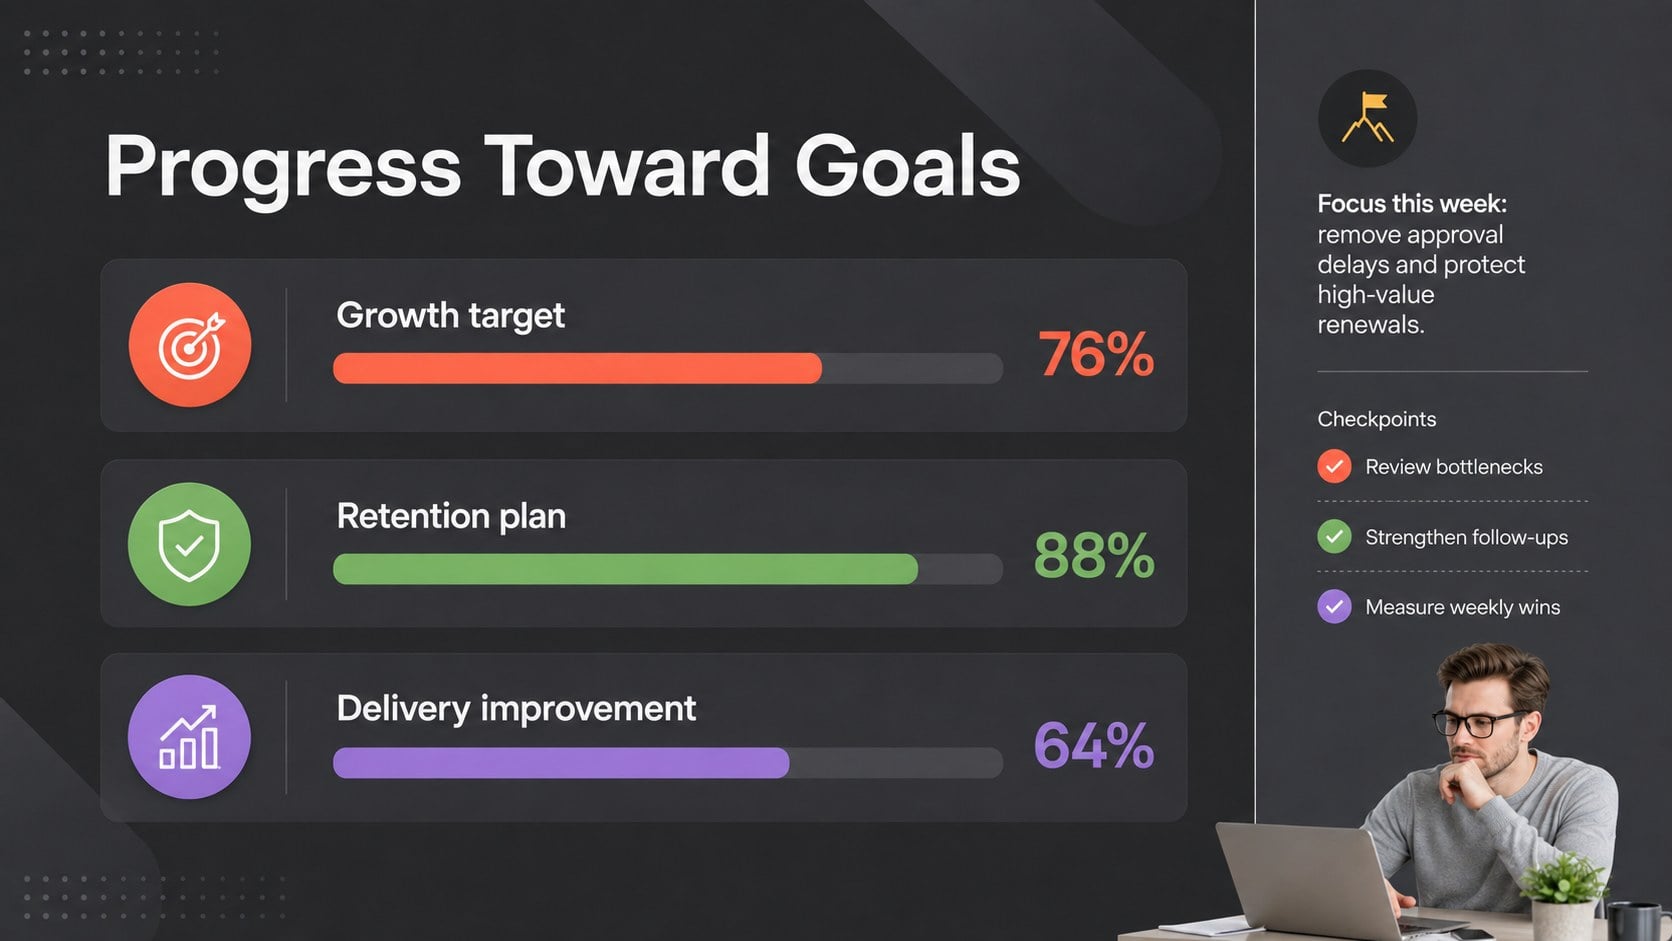
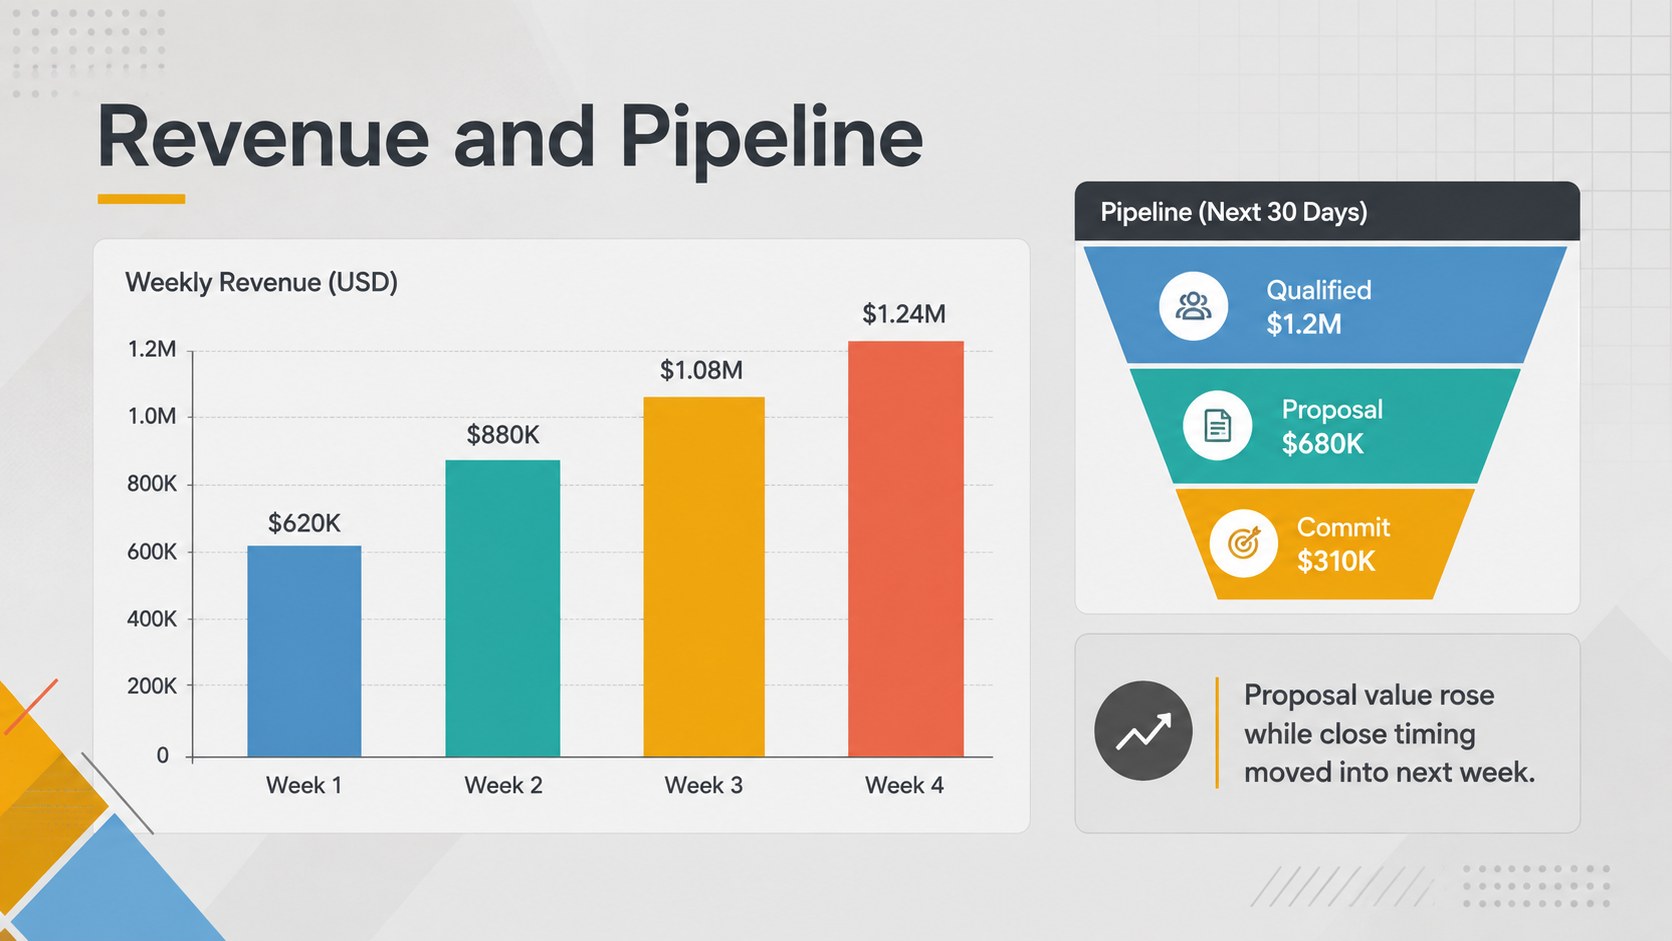
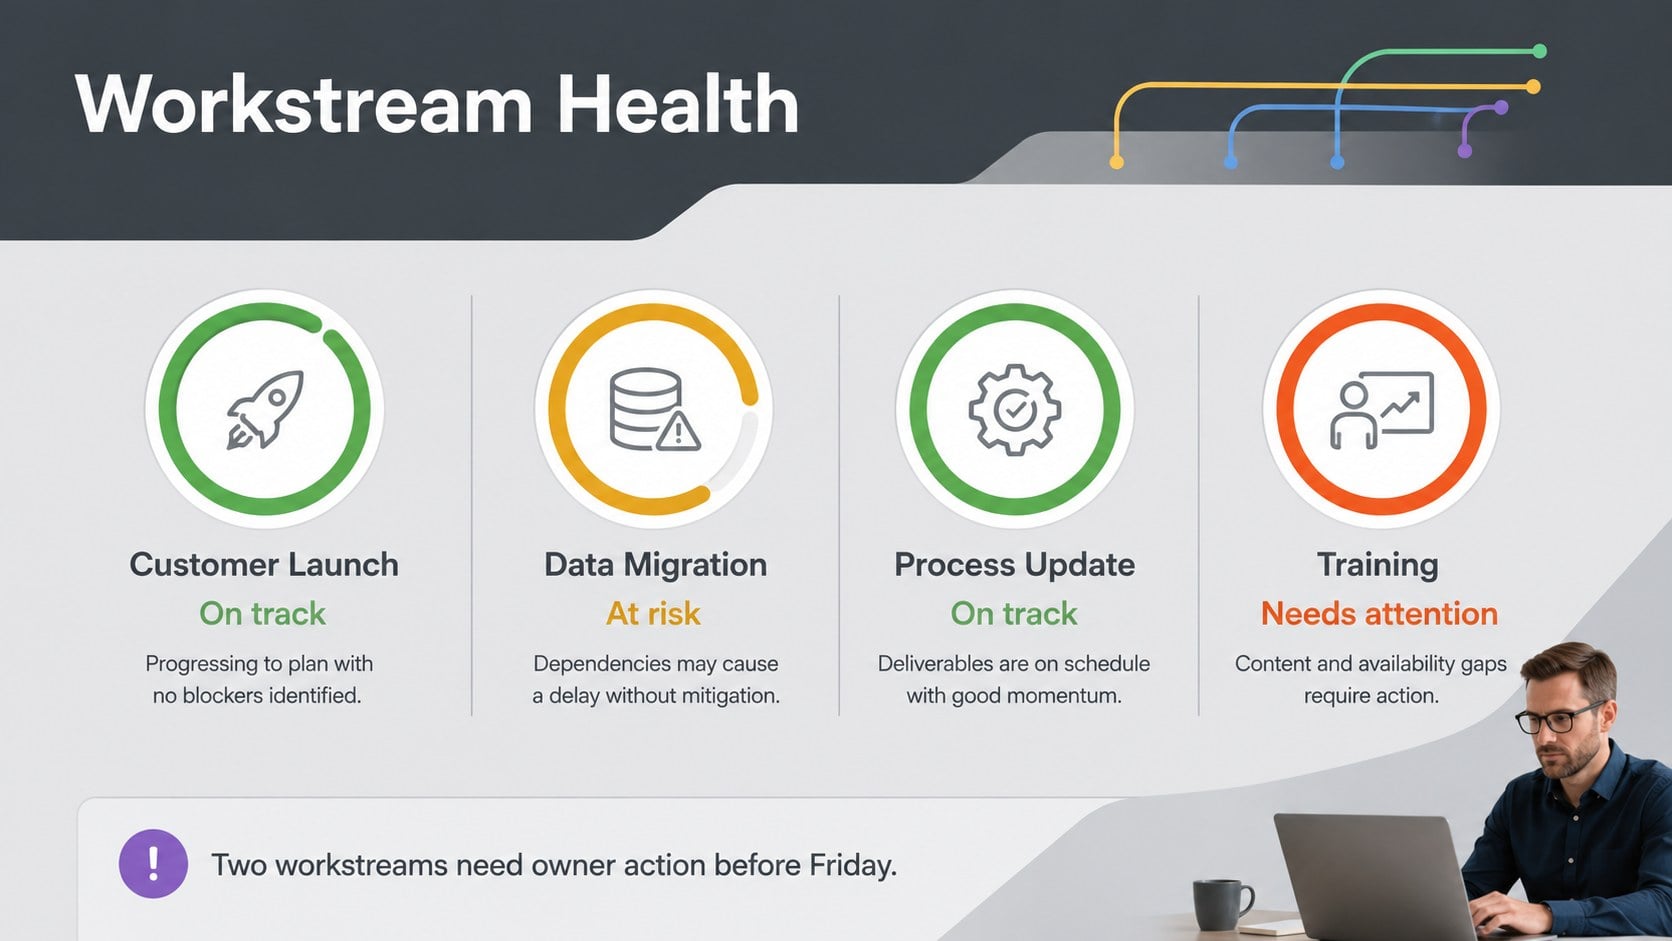
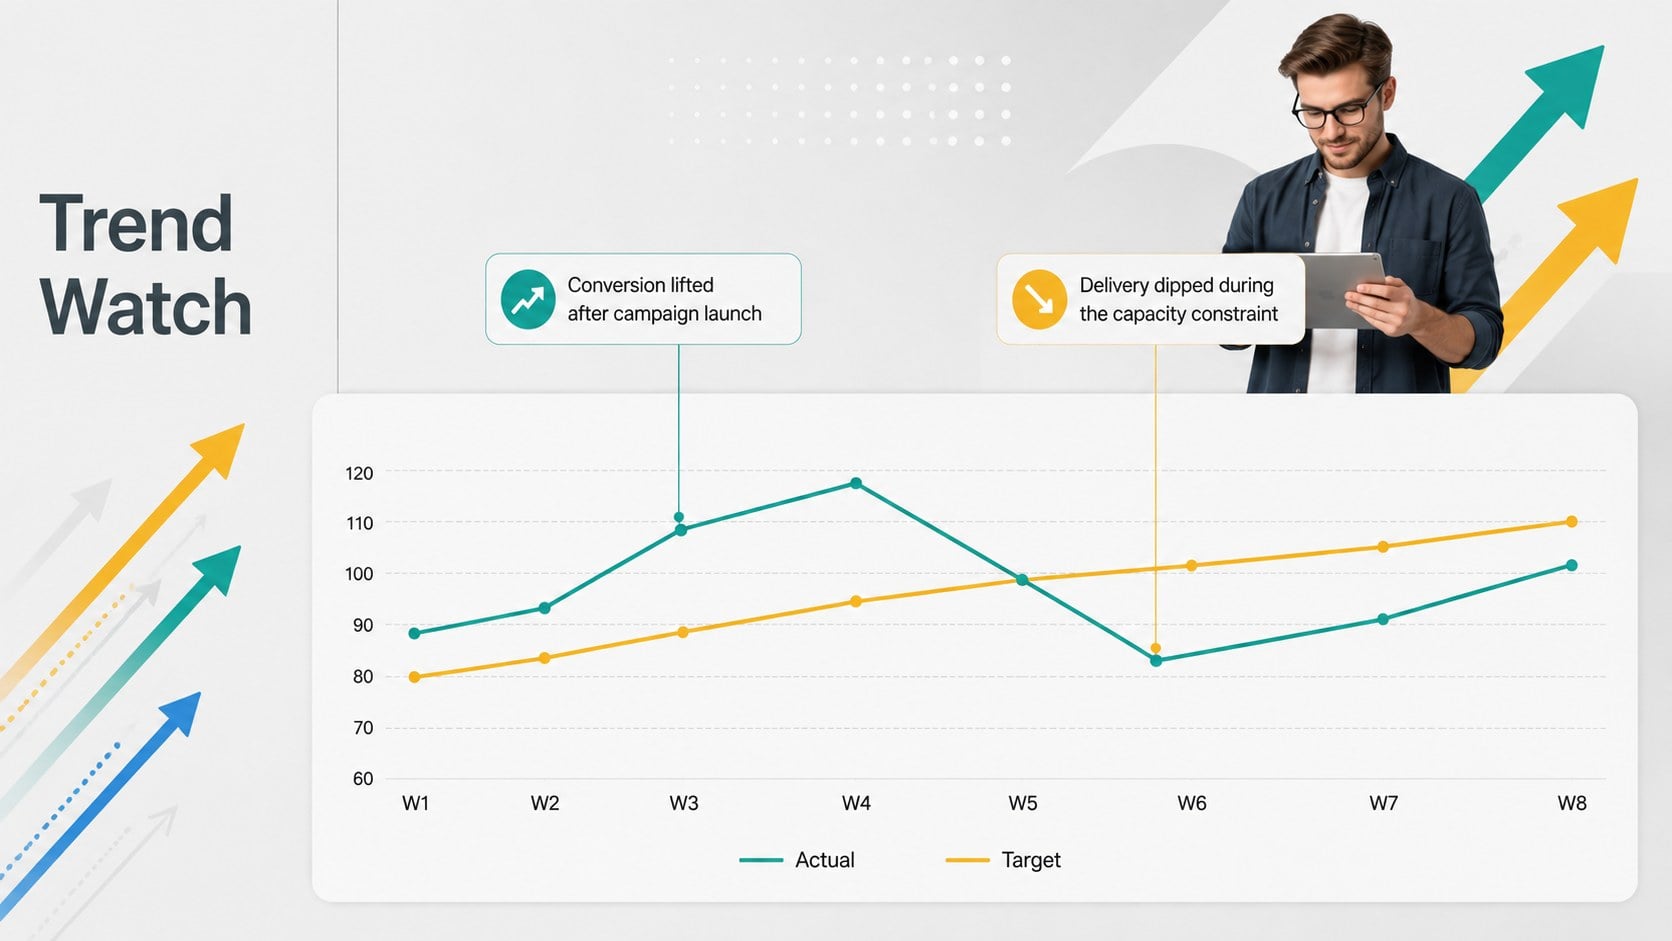
Turn raw numbers into a focused weekly story. Clean grey layouts help teams compare targets, explain changes, and agree on the next priorities.
15 slides · Business
All 15 slides
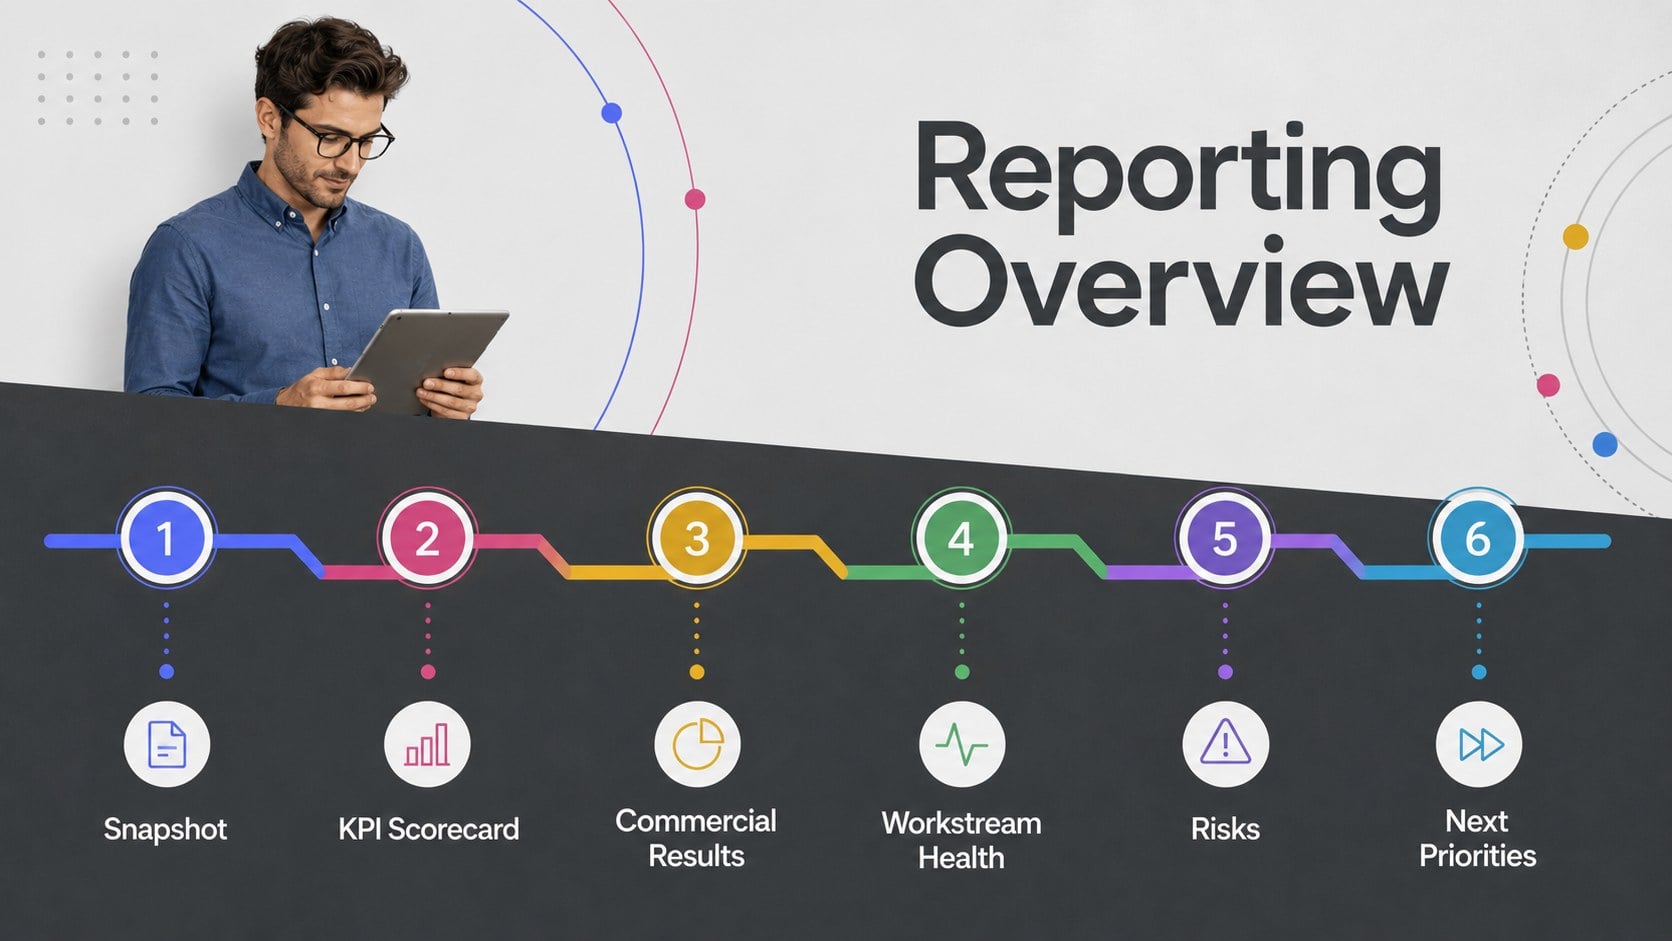
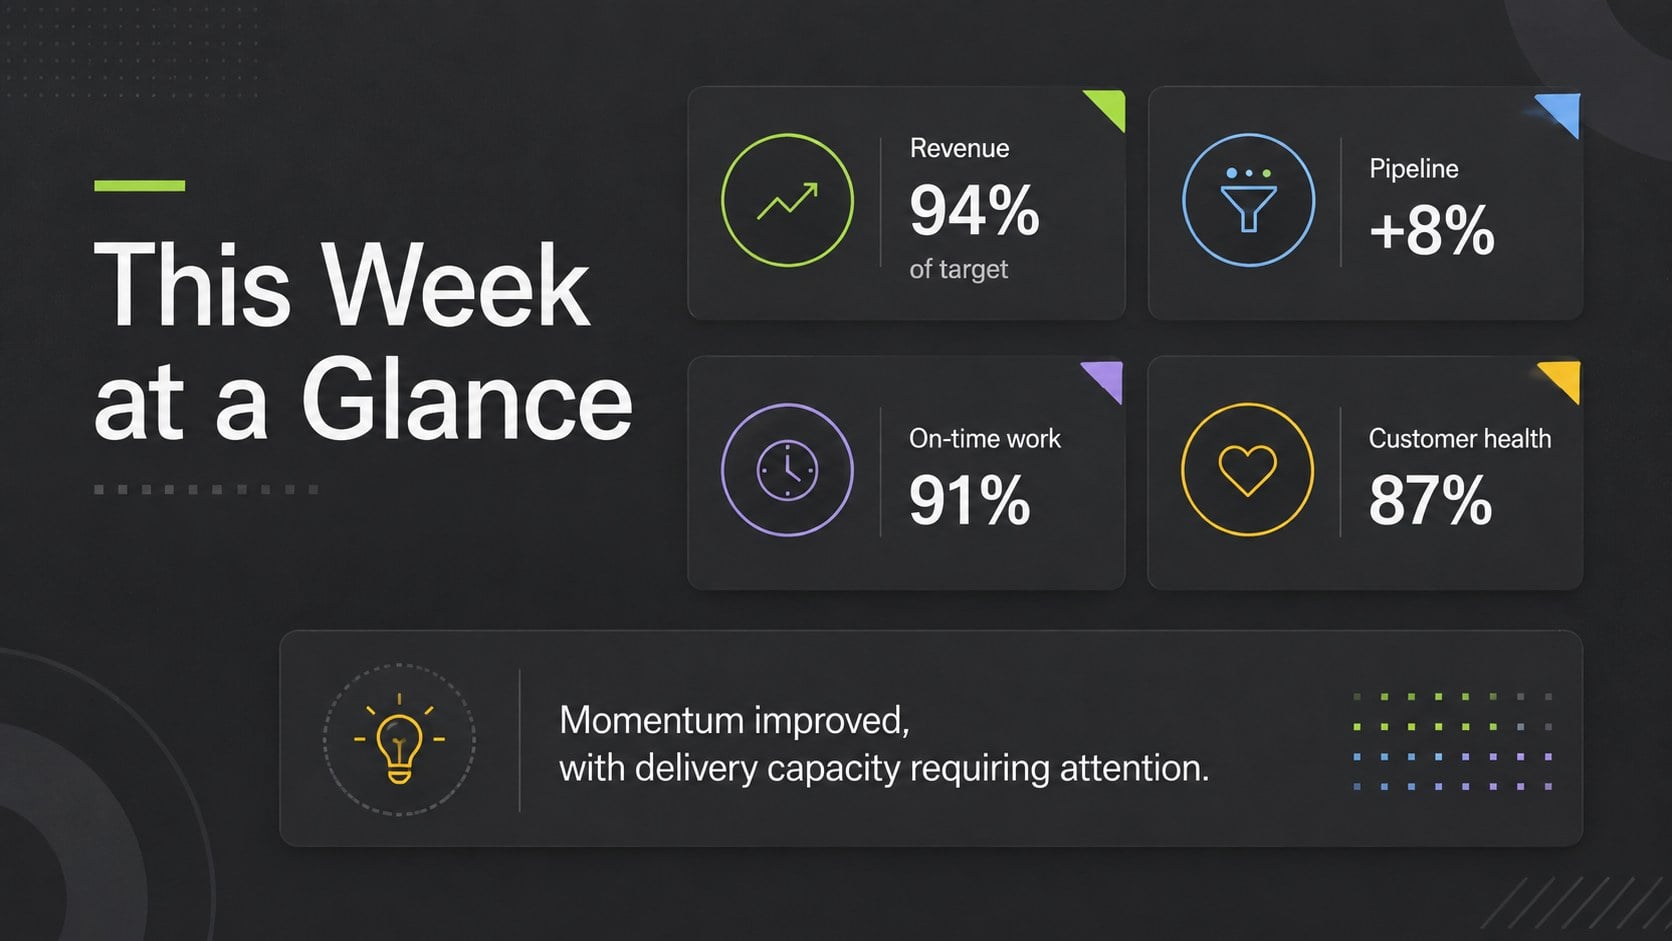
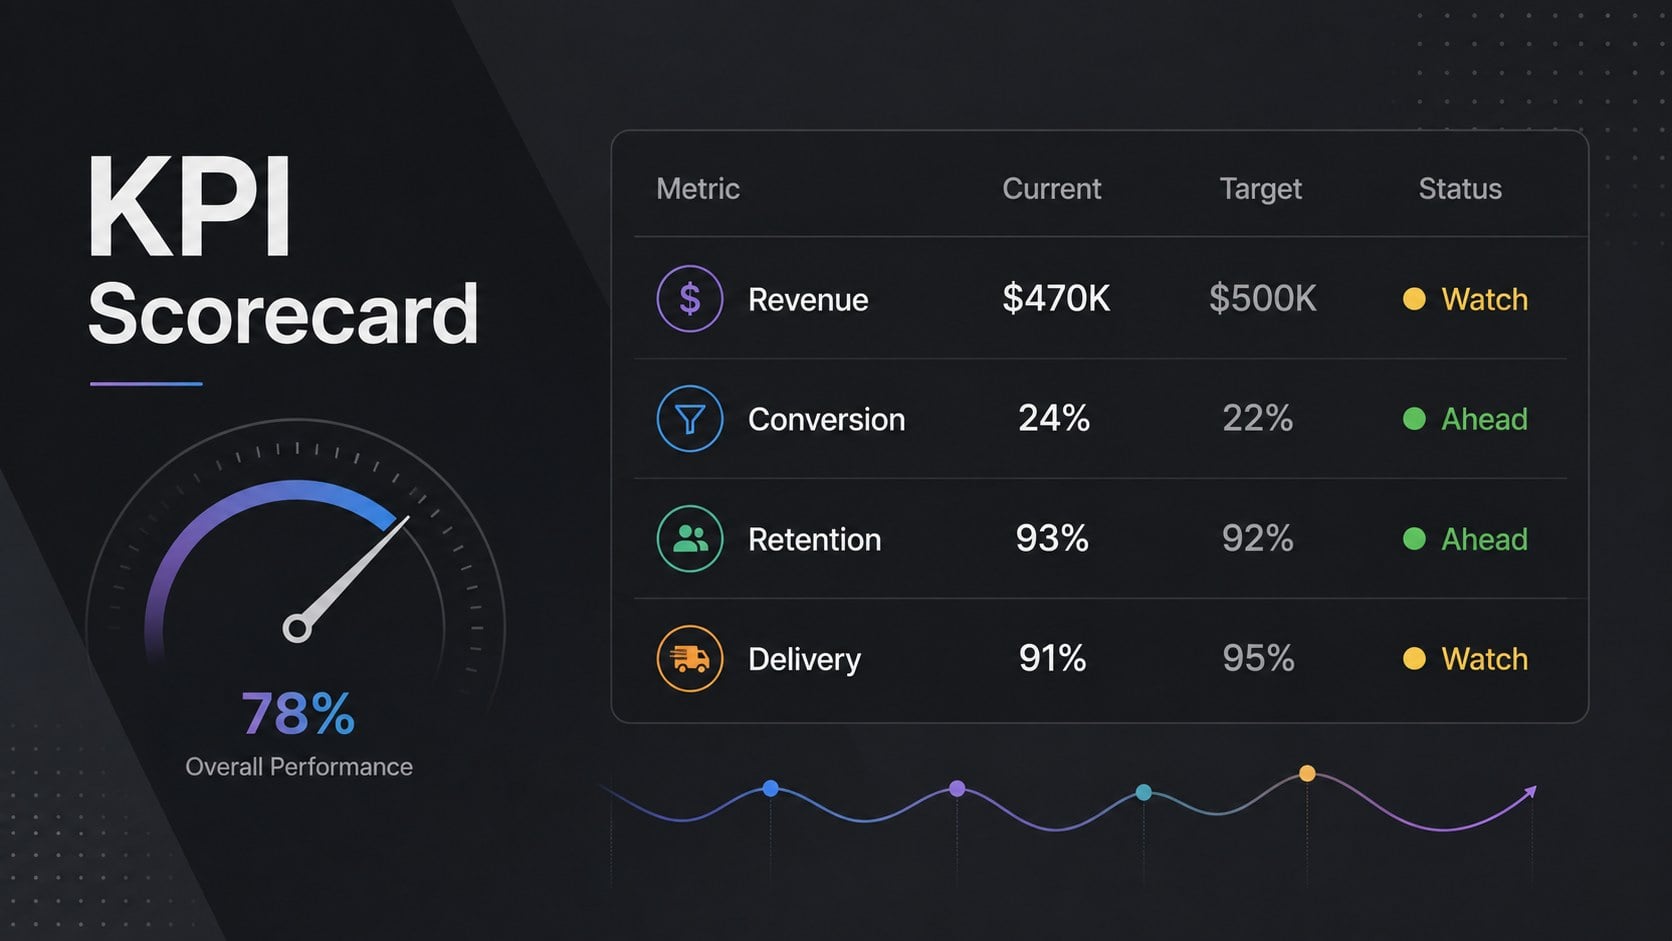
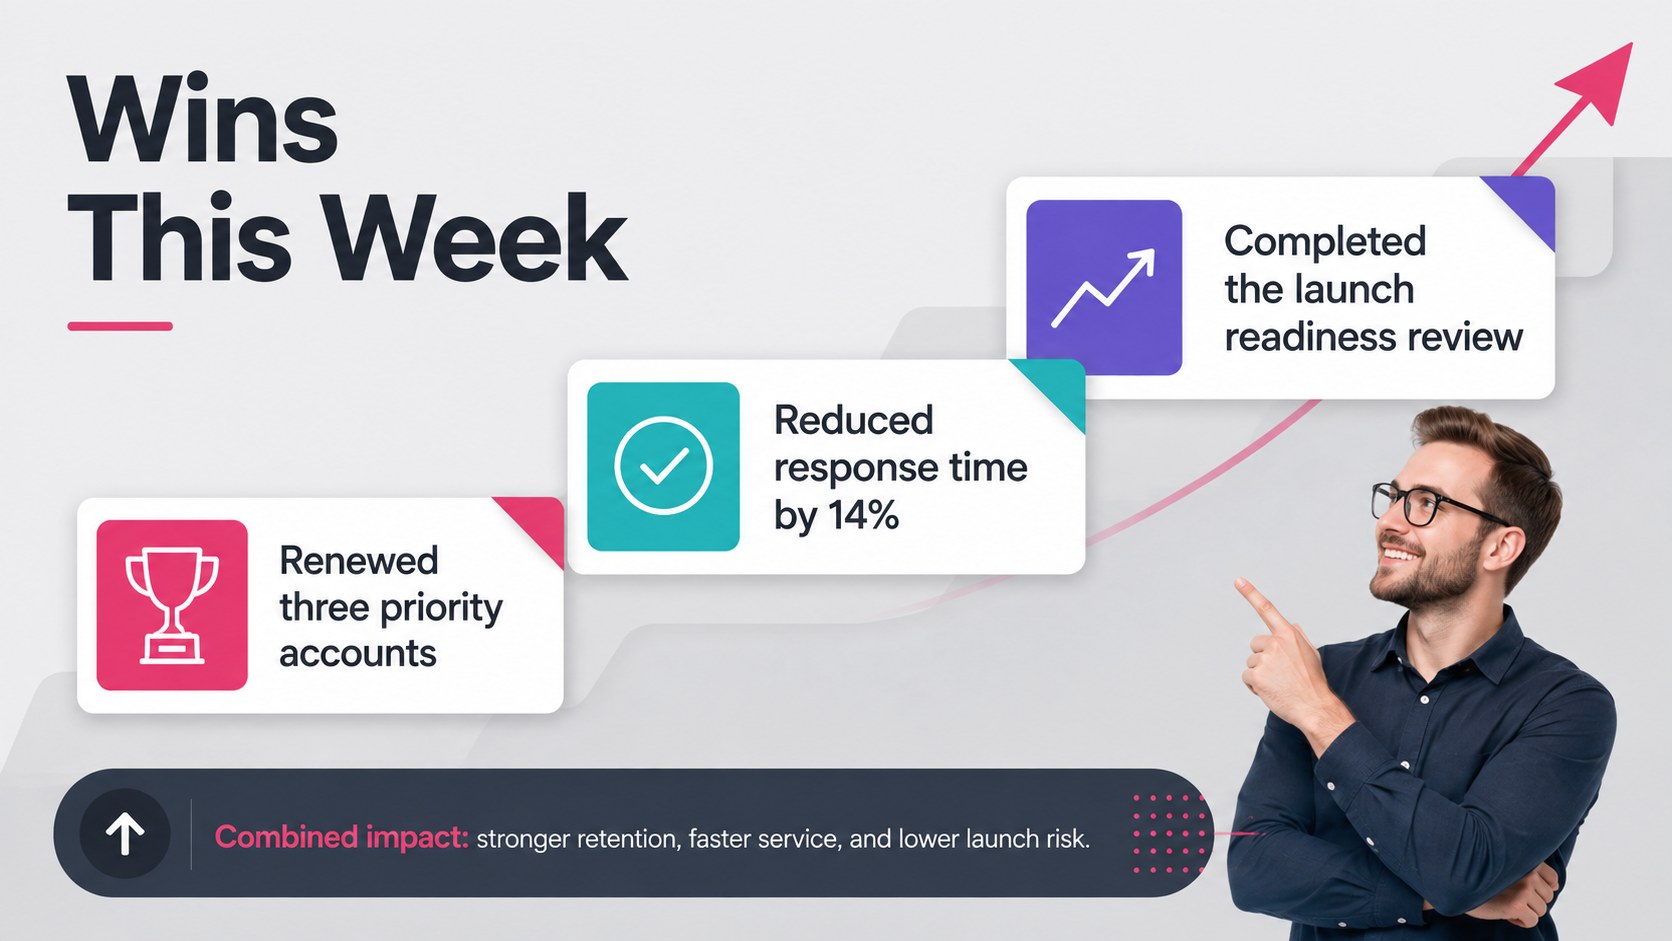
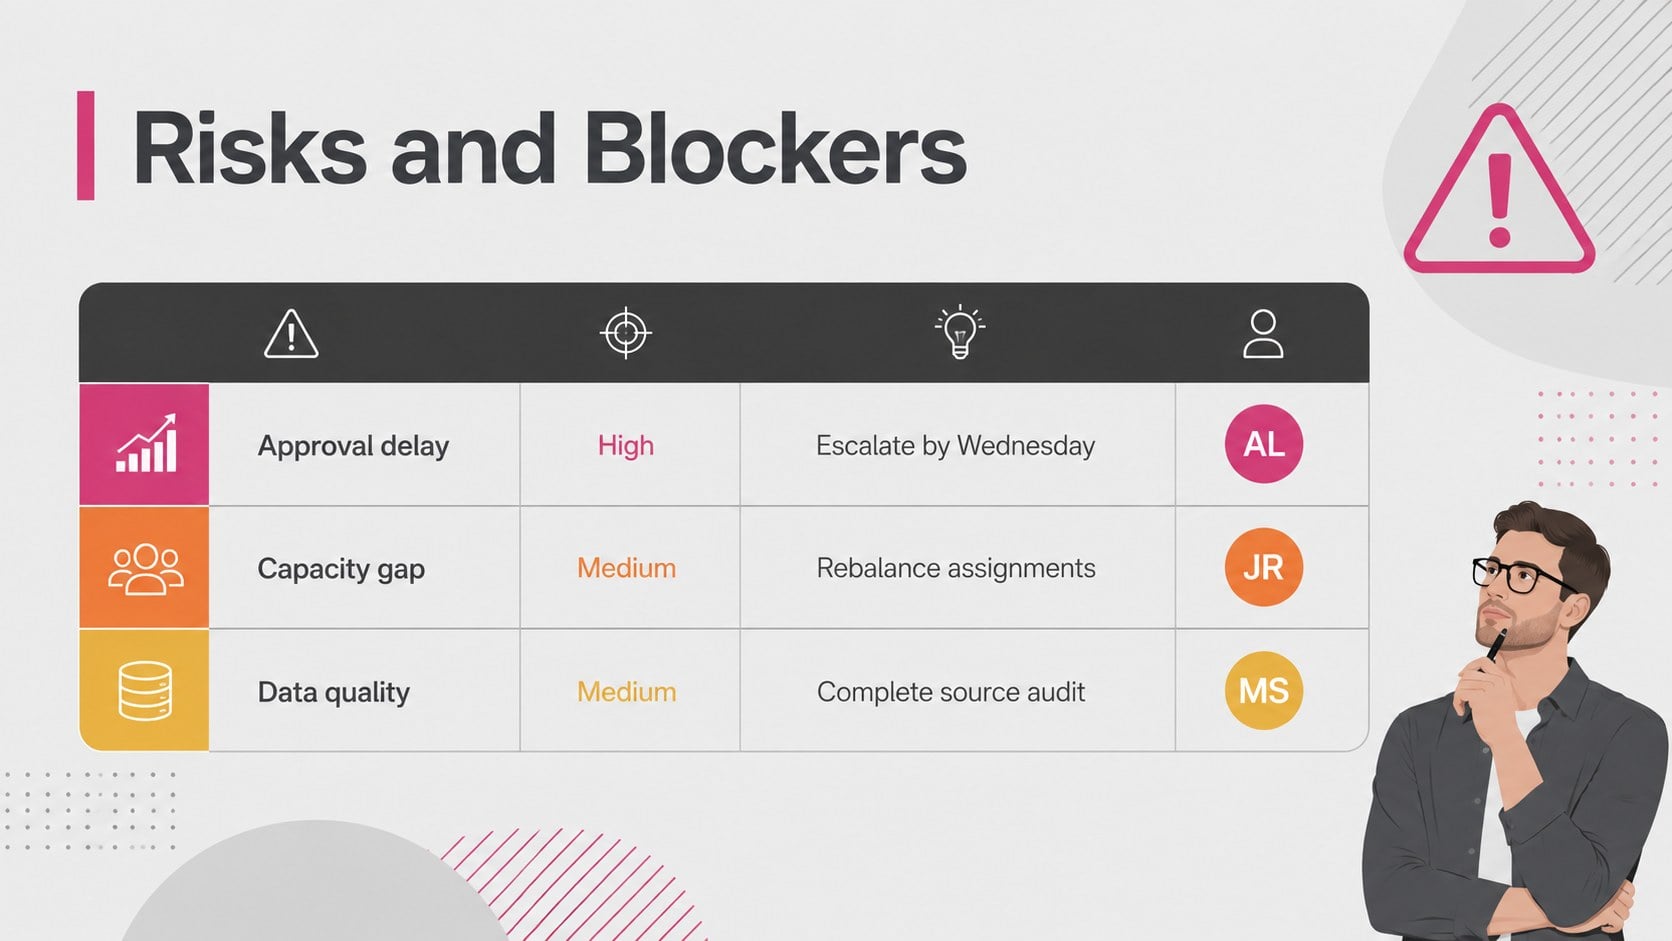
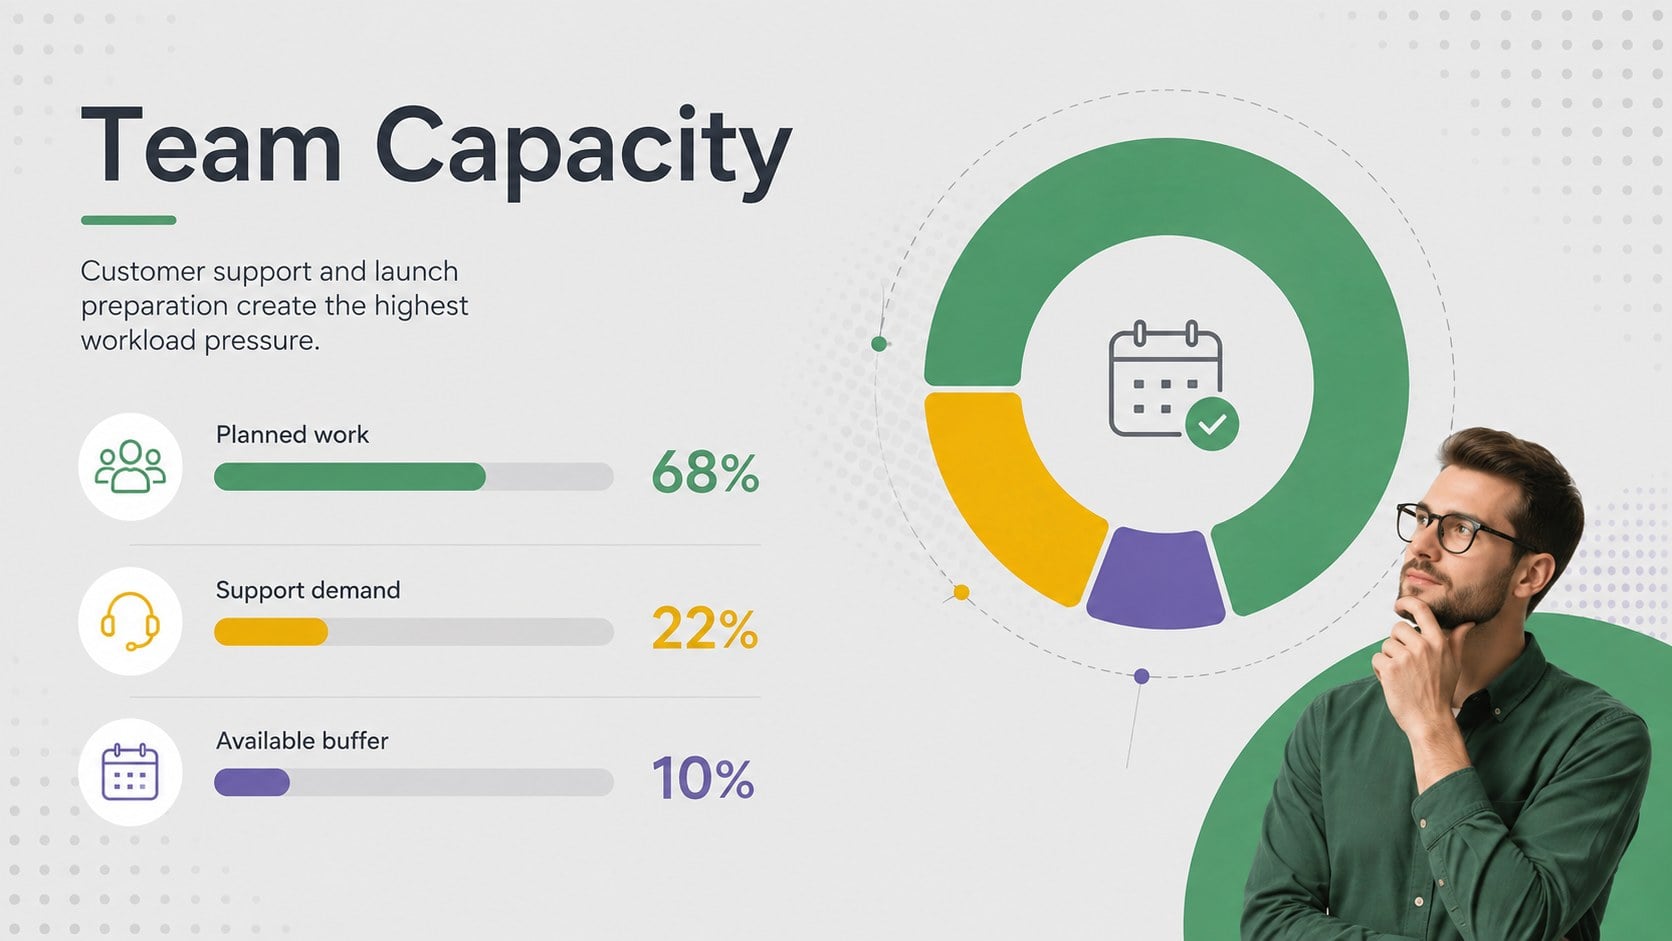
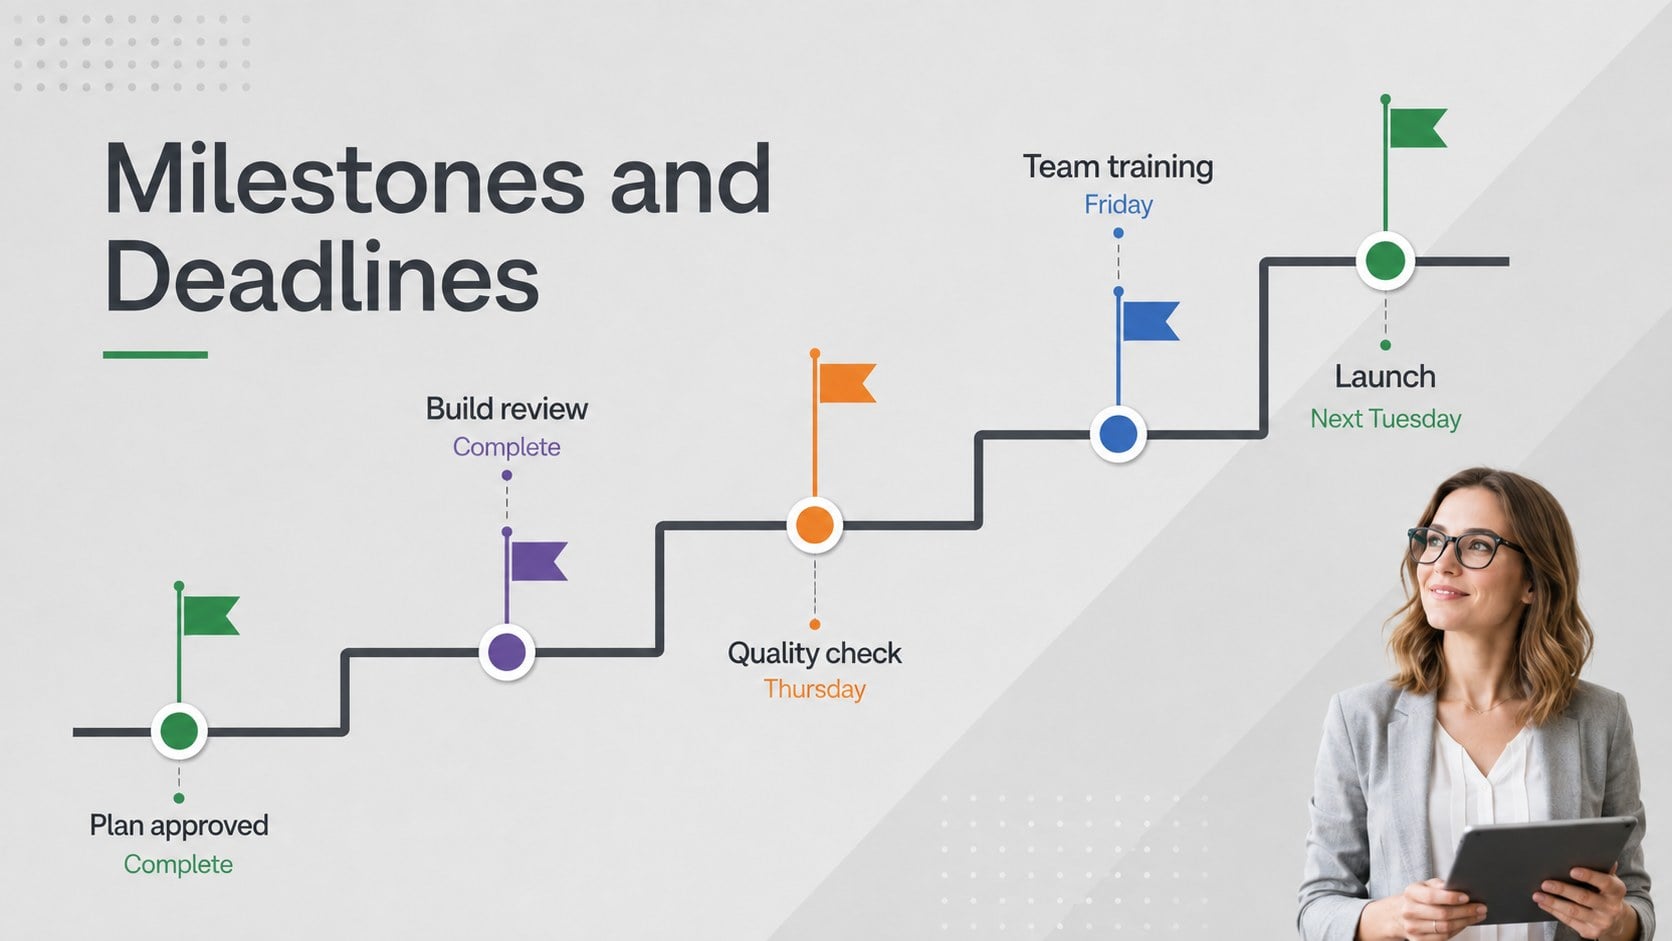
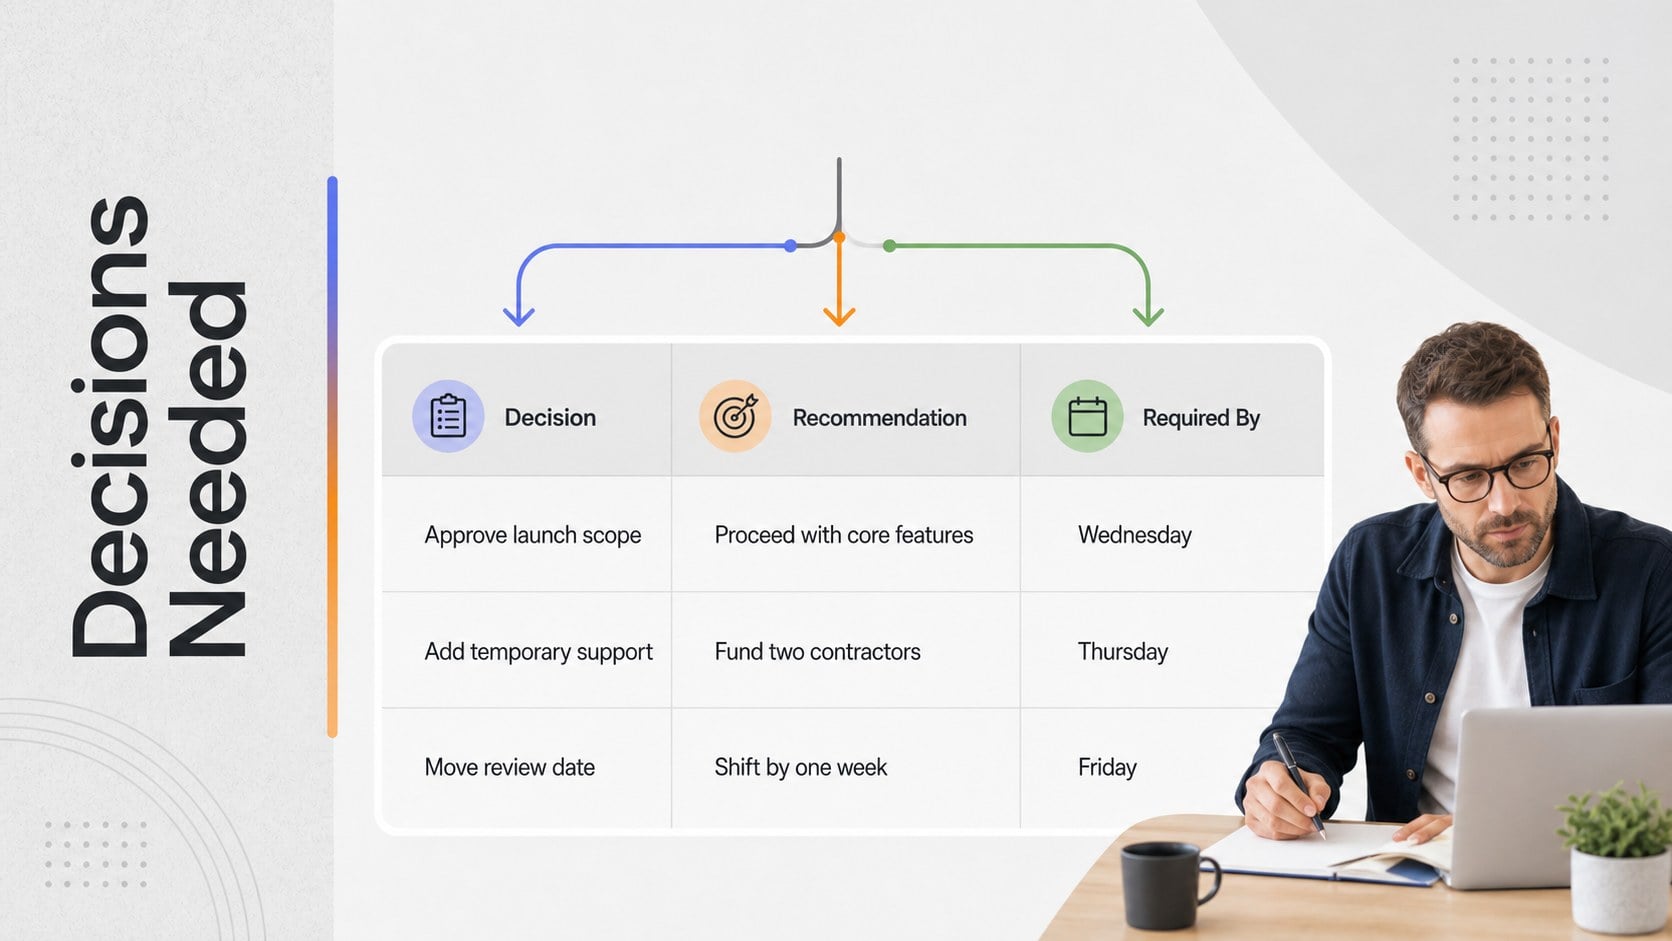
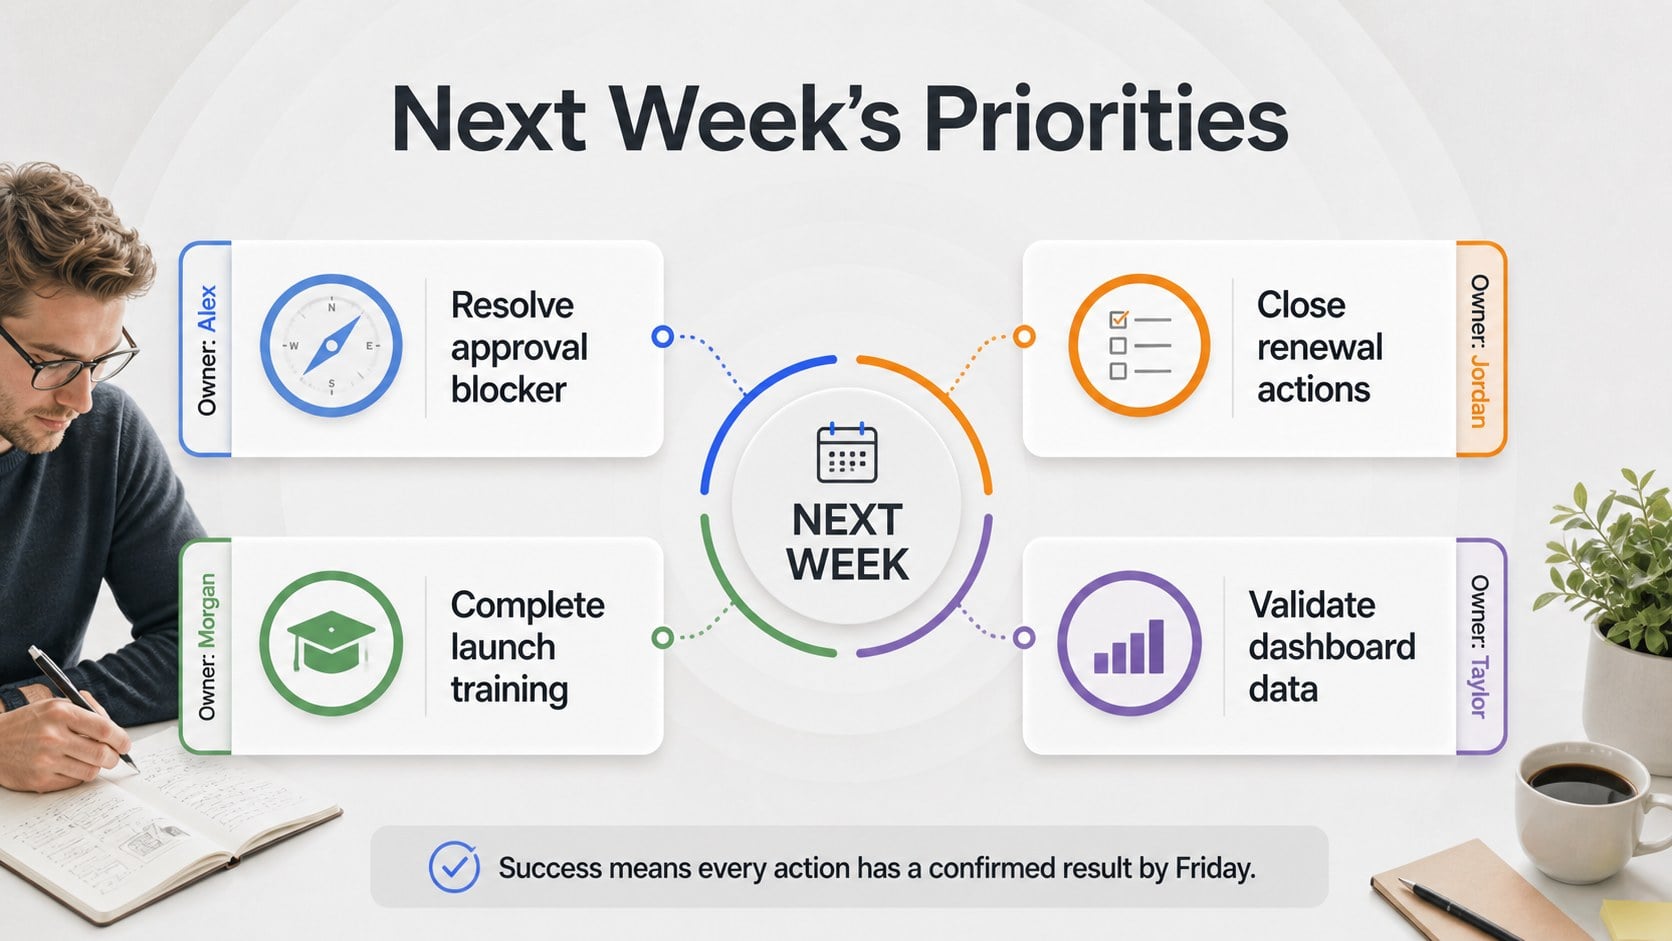
Every slide in the template. Ottermind keeps this look and writes your own content into it.

How to use this template
- 1
Click “Use this template” to open it in Ottermind Studio.
- 2
Describe your topic, audience and key points — or attach notes and files.
- 3
Ottermind generates an editable deck in this style. Edit text, adjust slides and export.
Tags
- Business
- KPI Dashboard
- Weekly Update
- Performance Metrics
- Progress Tracking
- Data Visualization
- Executive Reporting
- Project Management
- Sales Reporting
- Corporate
- Grey
- Modern
More Business templates
 Icon Grid Teamwork Theme16 slides
 Annual Goals Roadmap Infographic3 slides
 Annual Achievement Report Presentation15 slides
 Annual Performance Evaluation Report Slides15 slides
 Business Results Retrospective Slides15 slides
 Color-Coded Workflow Path Slides6 slides
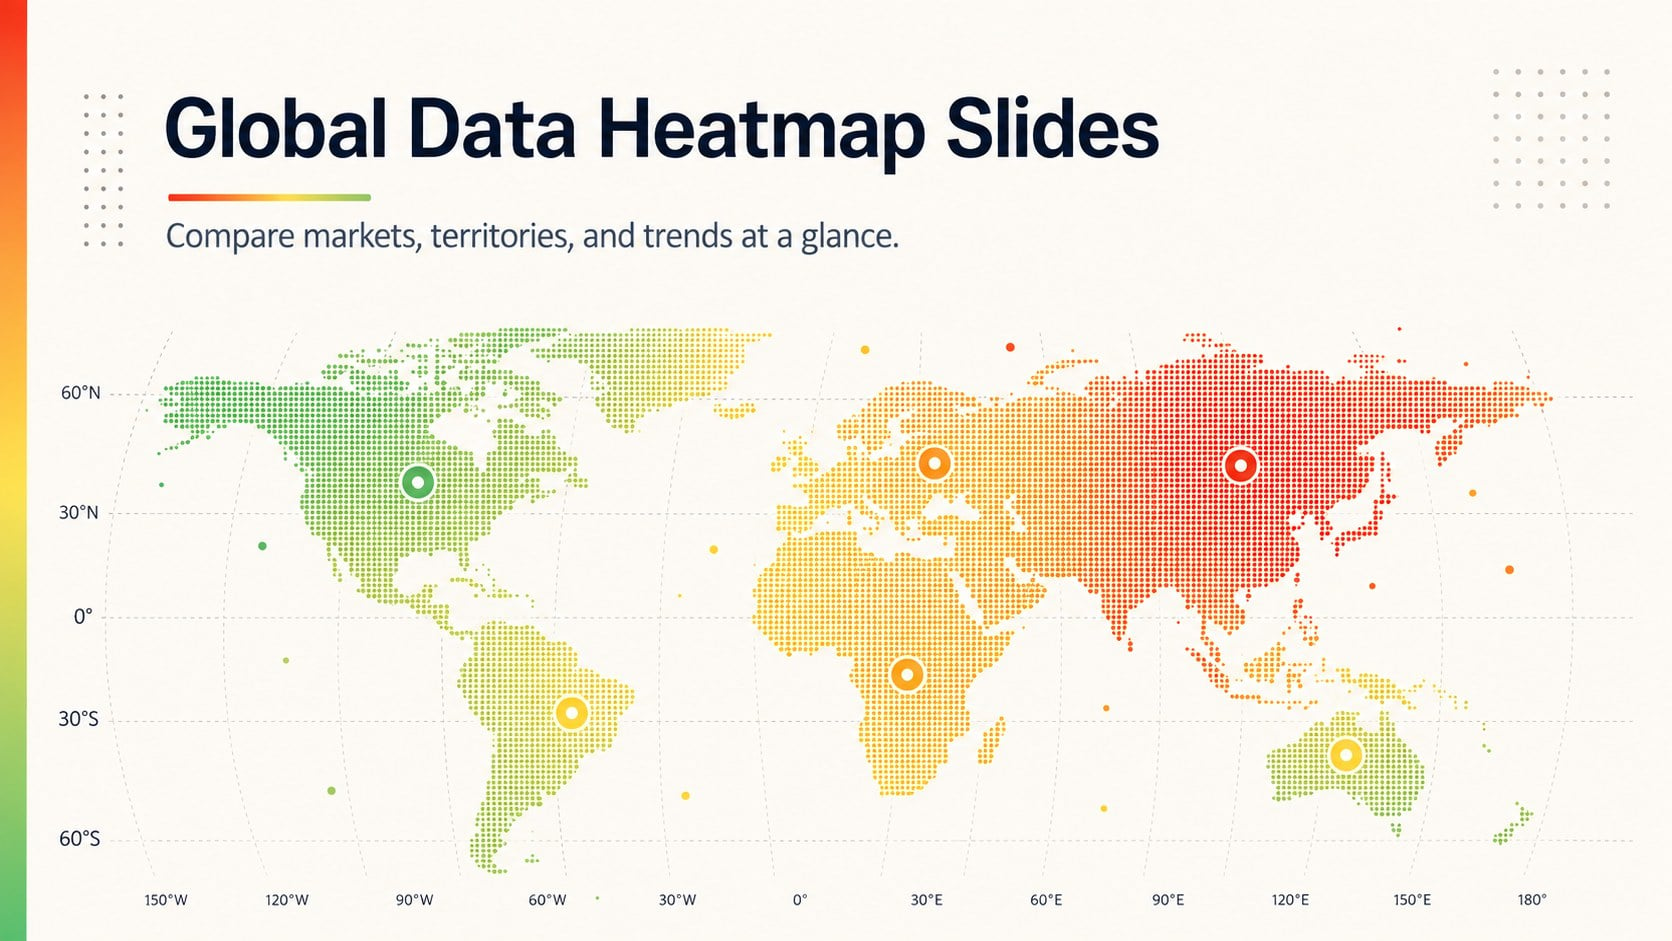 Global Data Heatmap Slides6 slides
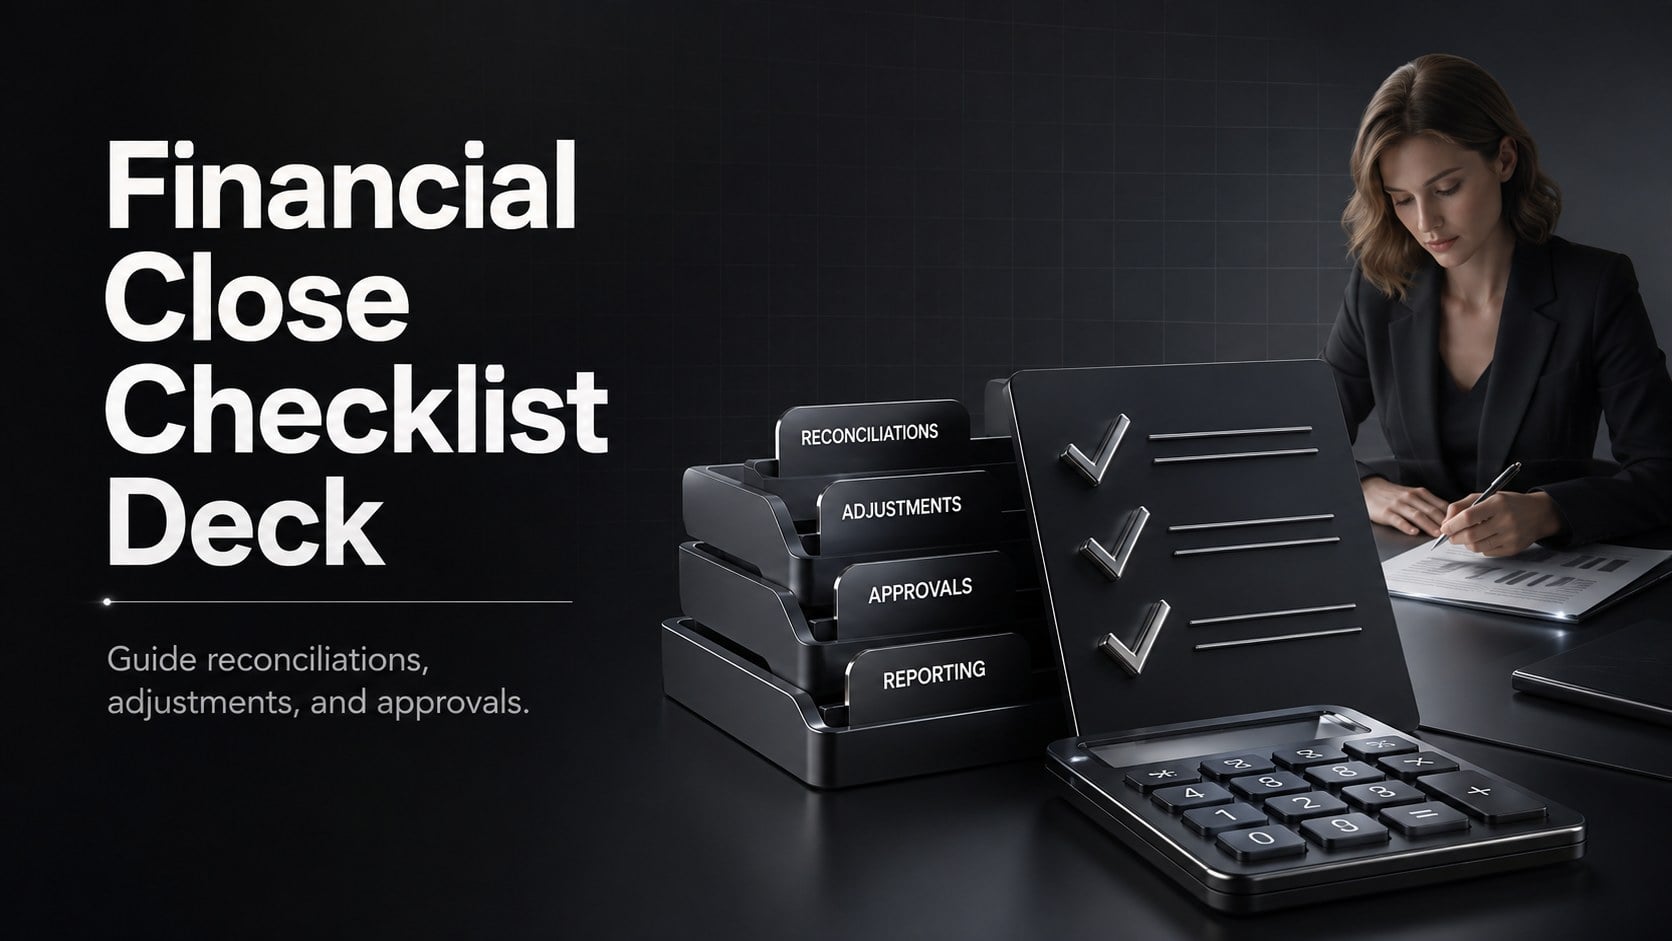 Financial Close Checklist Deck15 slides
Make your deck with Weekly KPI Progress Dashboard Deck
Pick this style, describe your topic, and get an editable presentation in minutes.