Presentation template
Cycle-Based Social Performance Dashboard
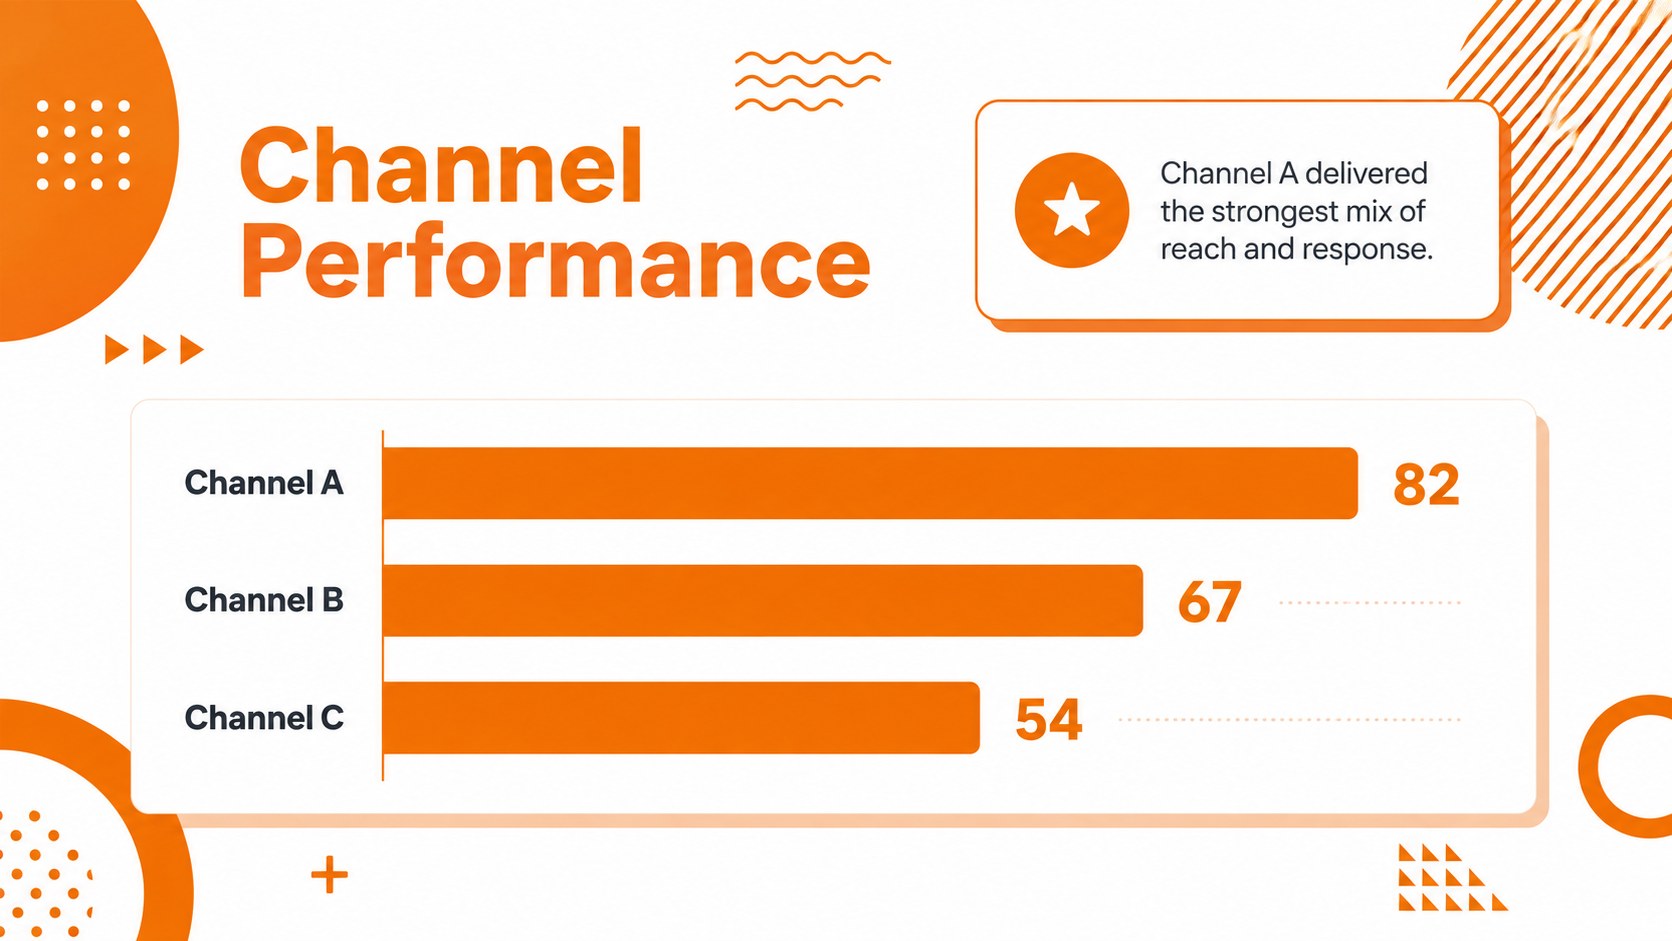
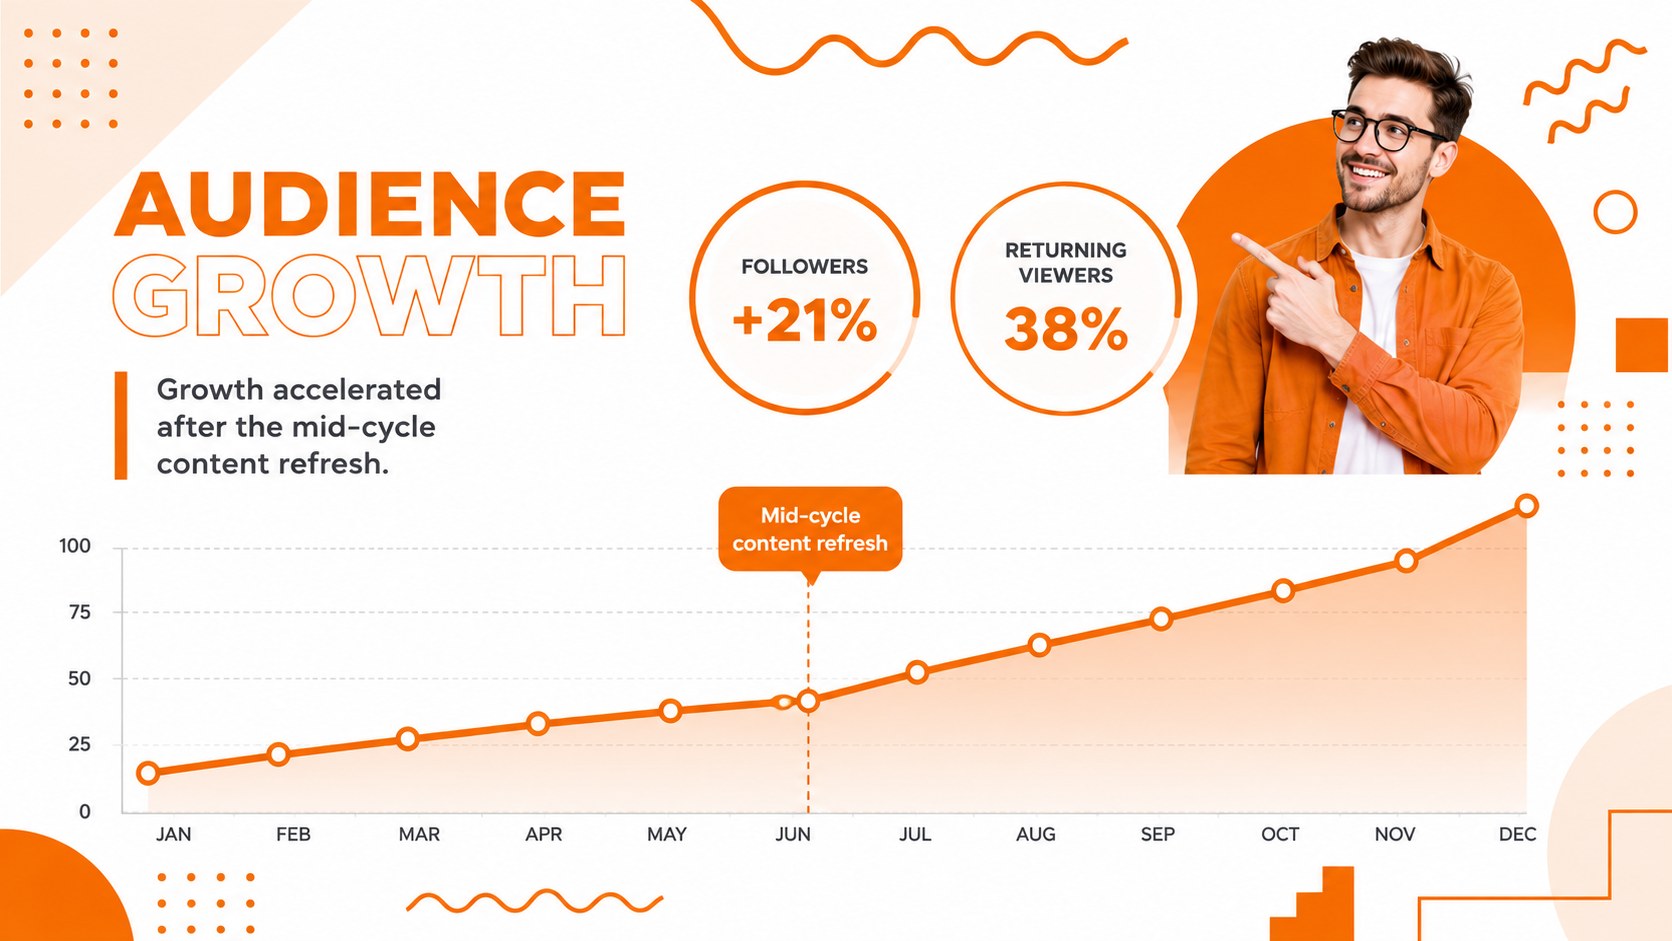
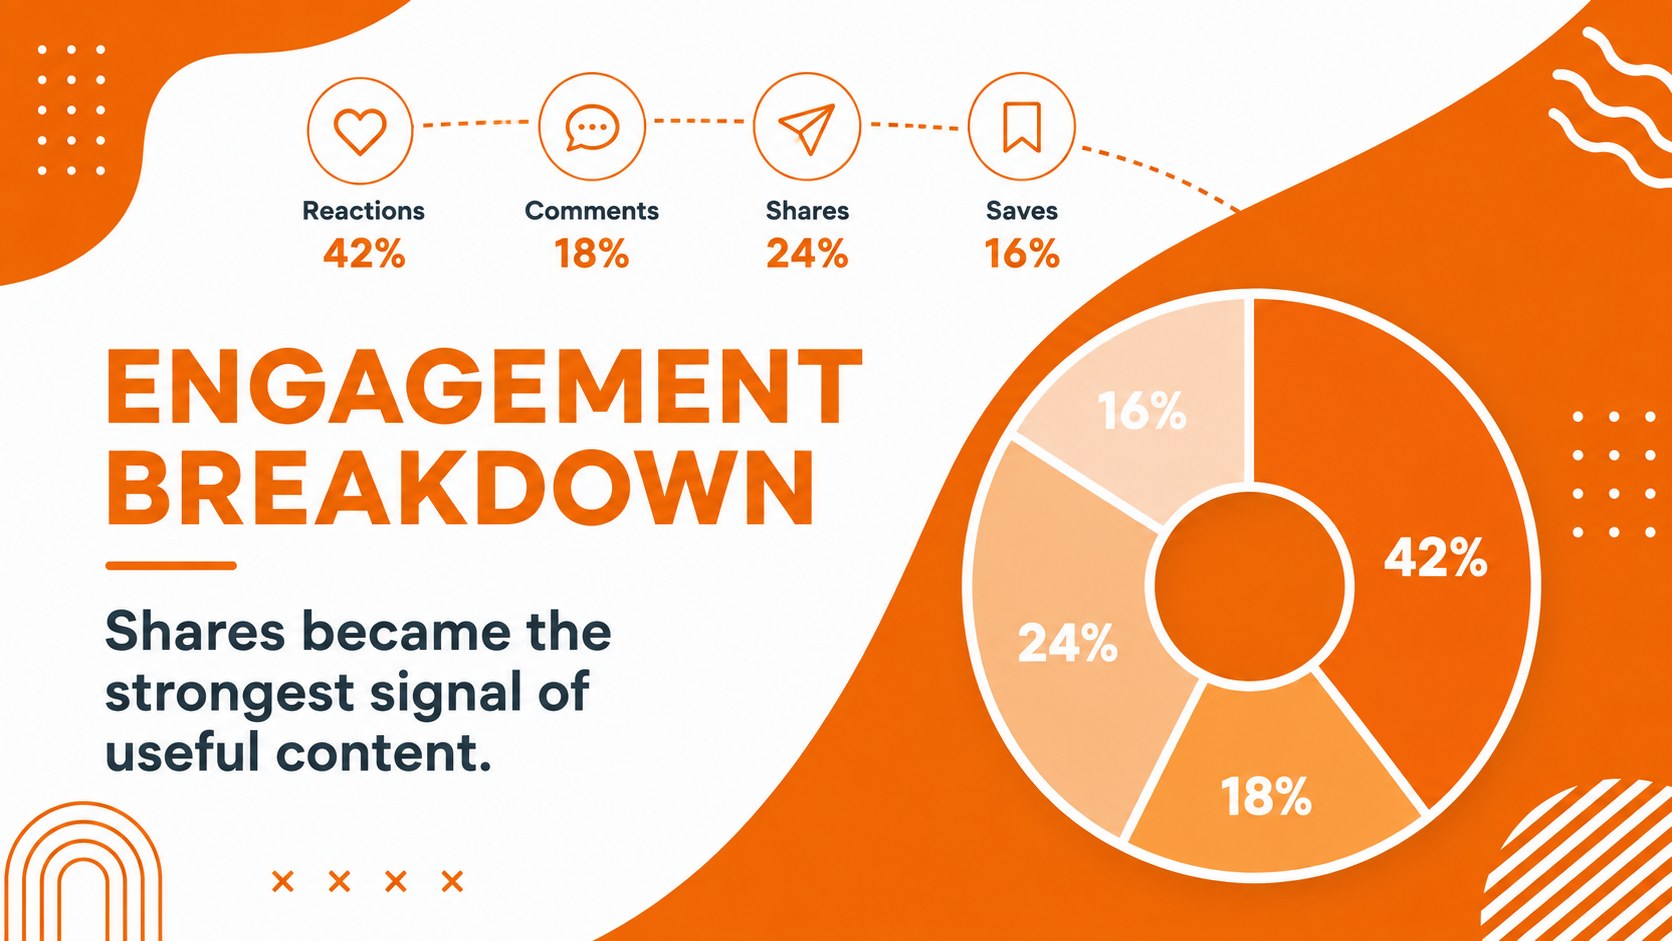
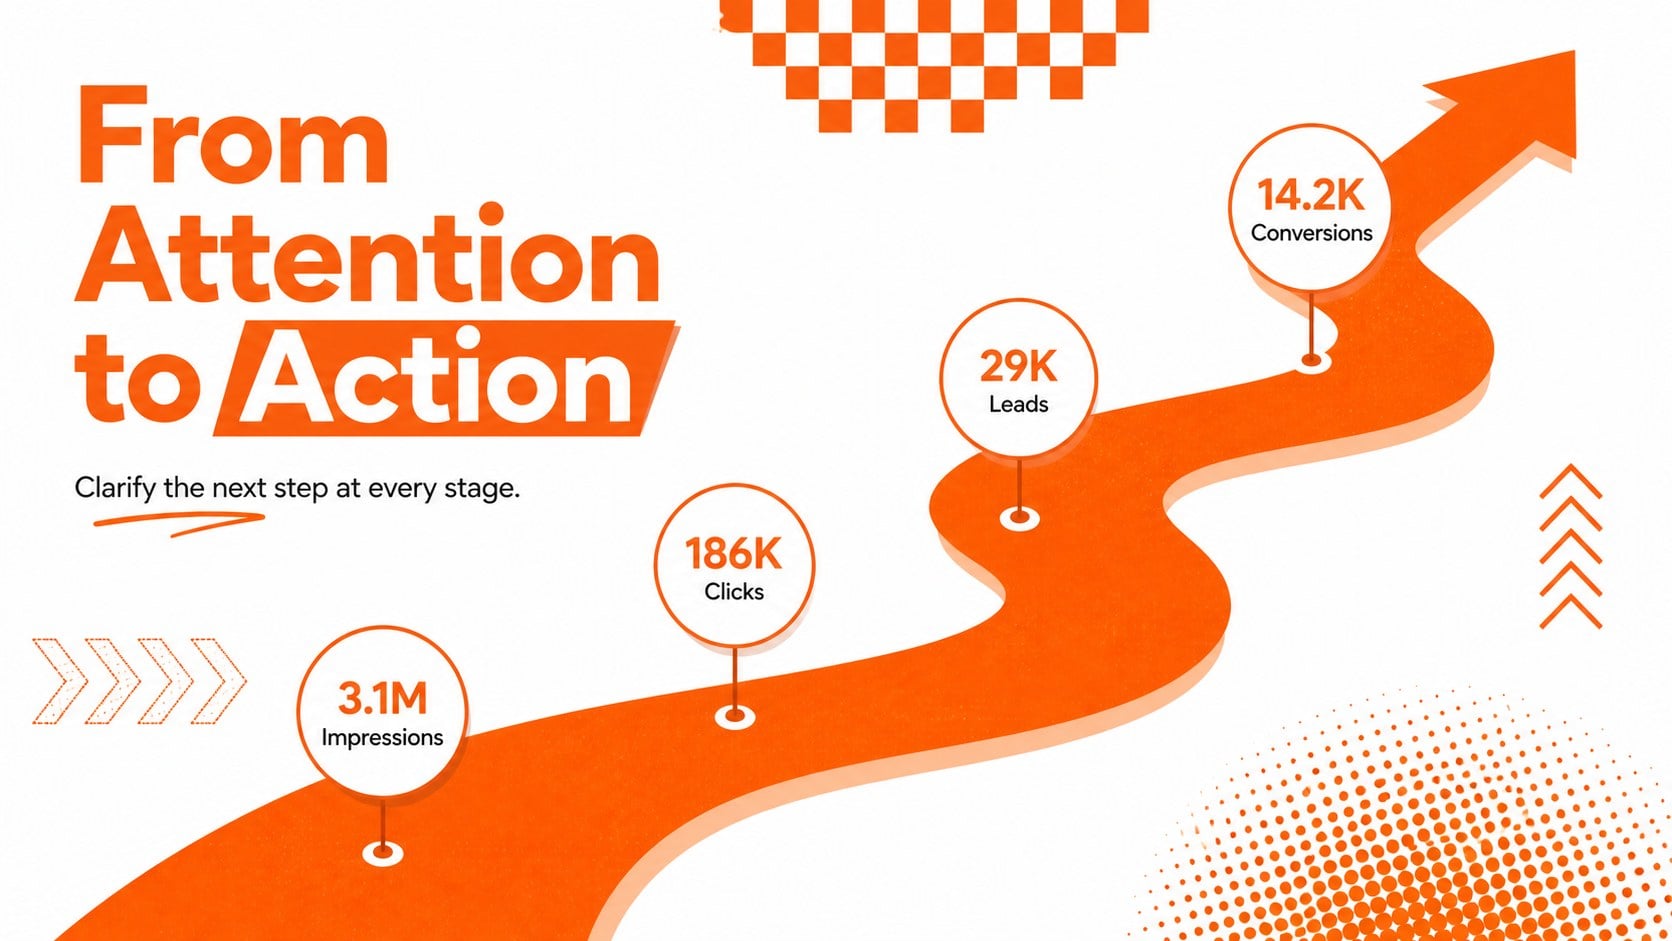
Turn recurring campaign data into an easy-to-scan story. Bold orange-and-white cycle visuals make progress, patterns, and next steps clear.
16 slides · Creative & Themes

All 16 slides
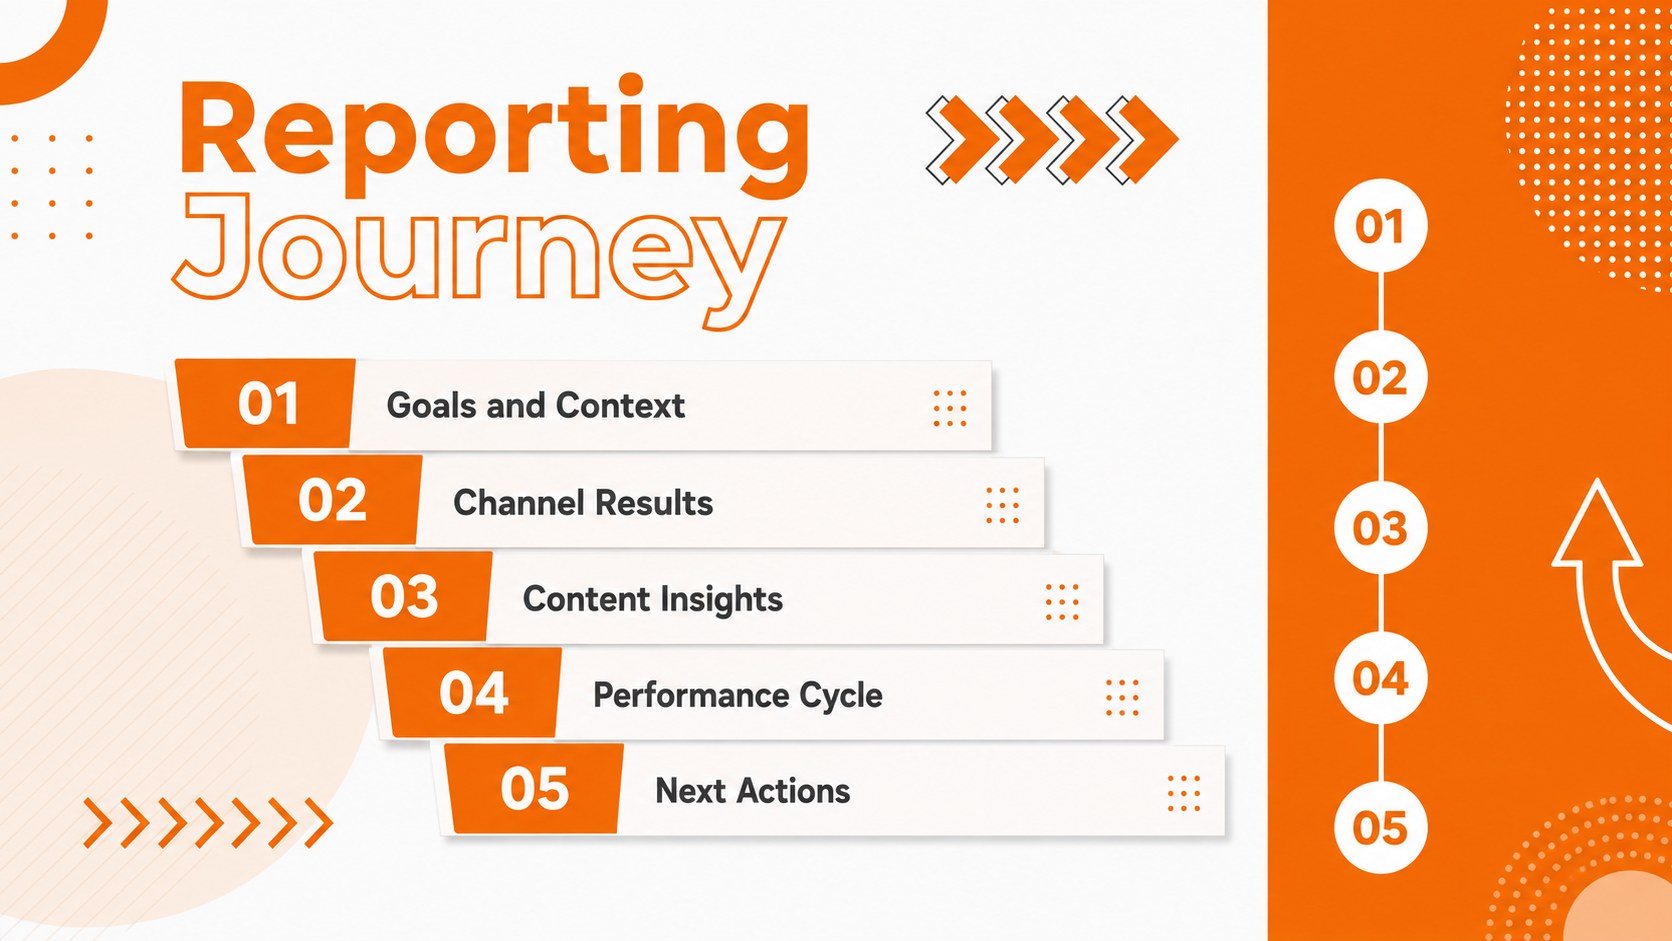
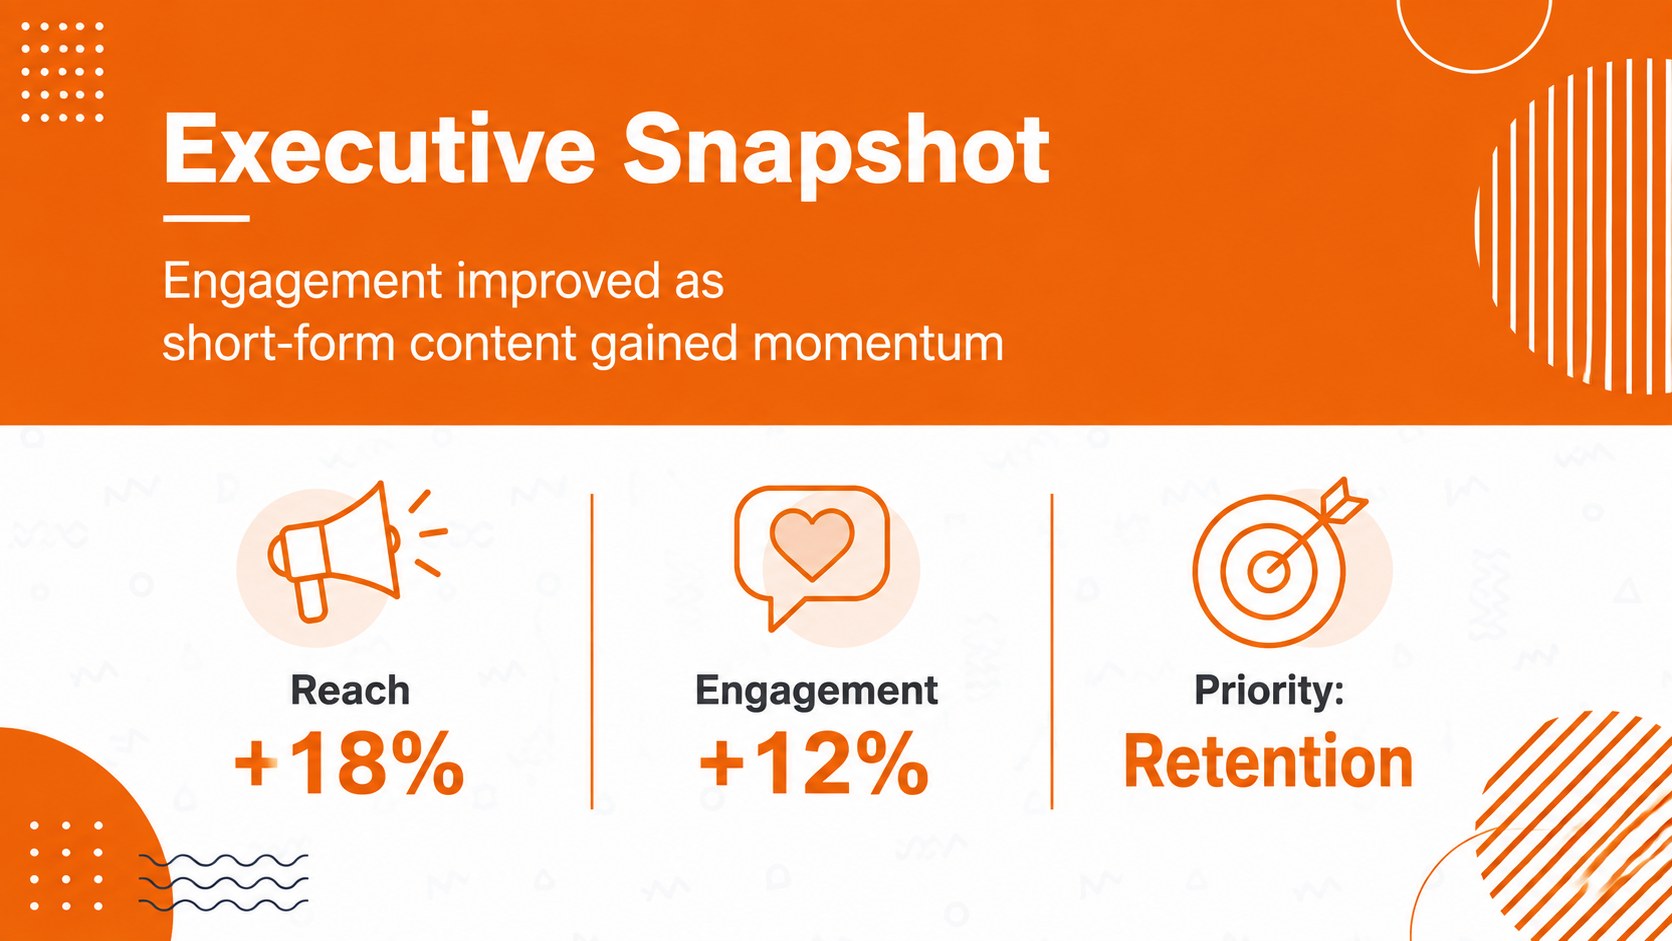
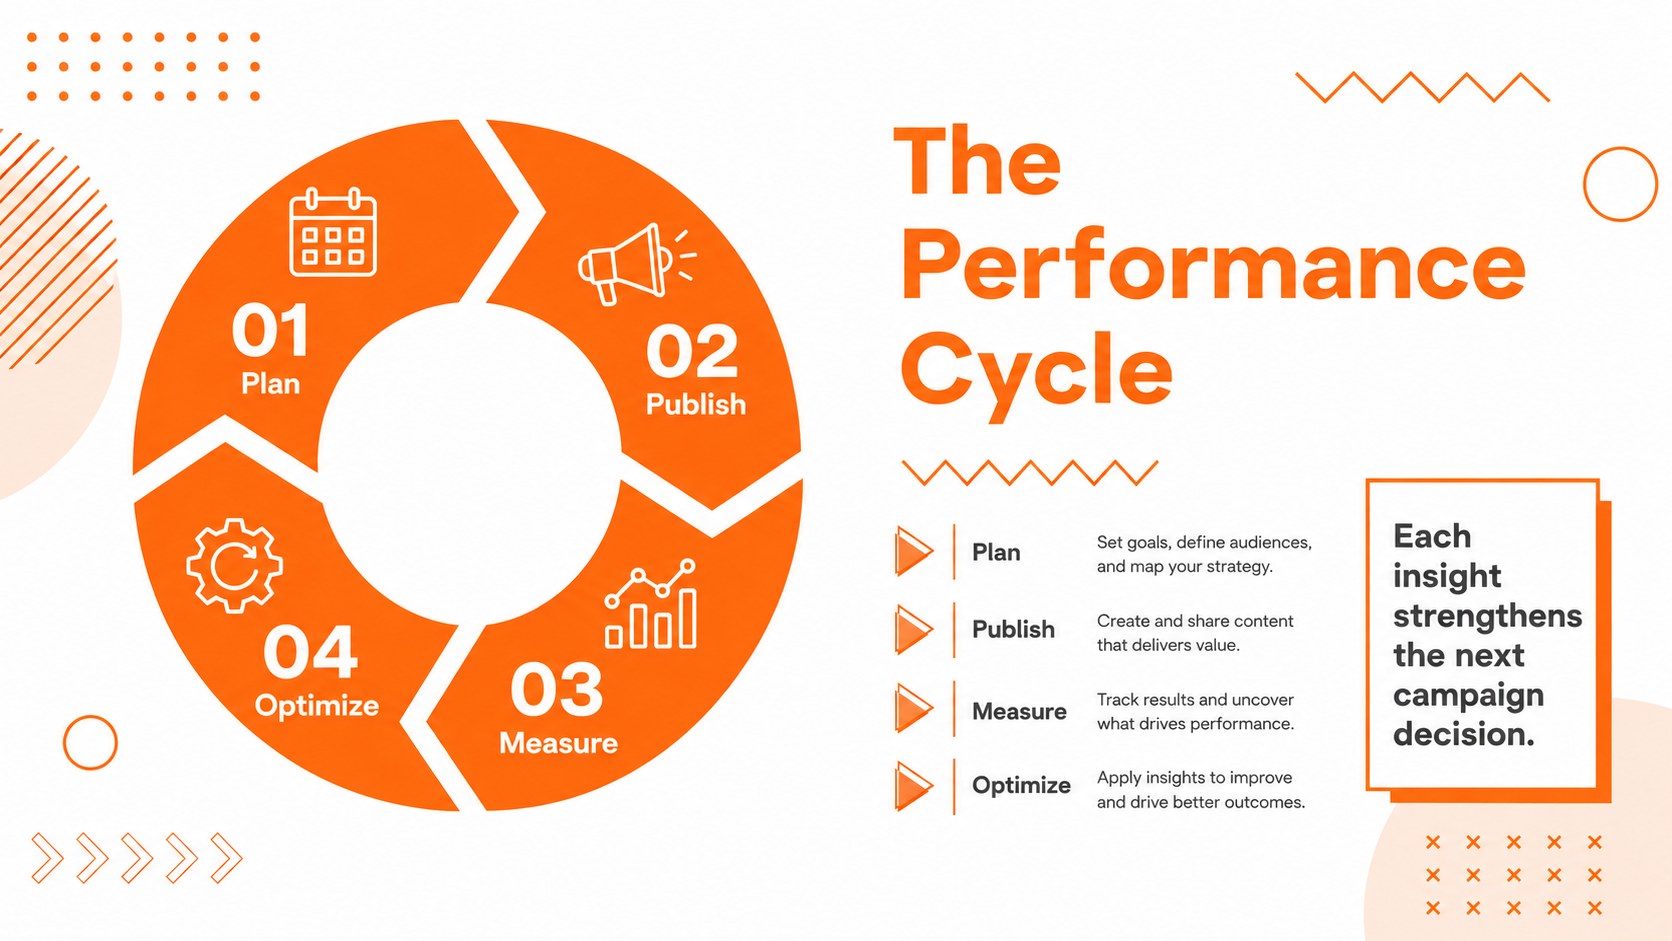
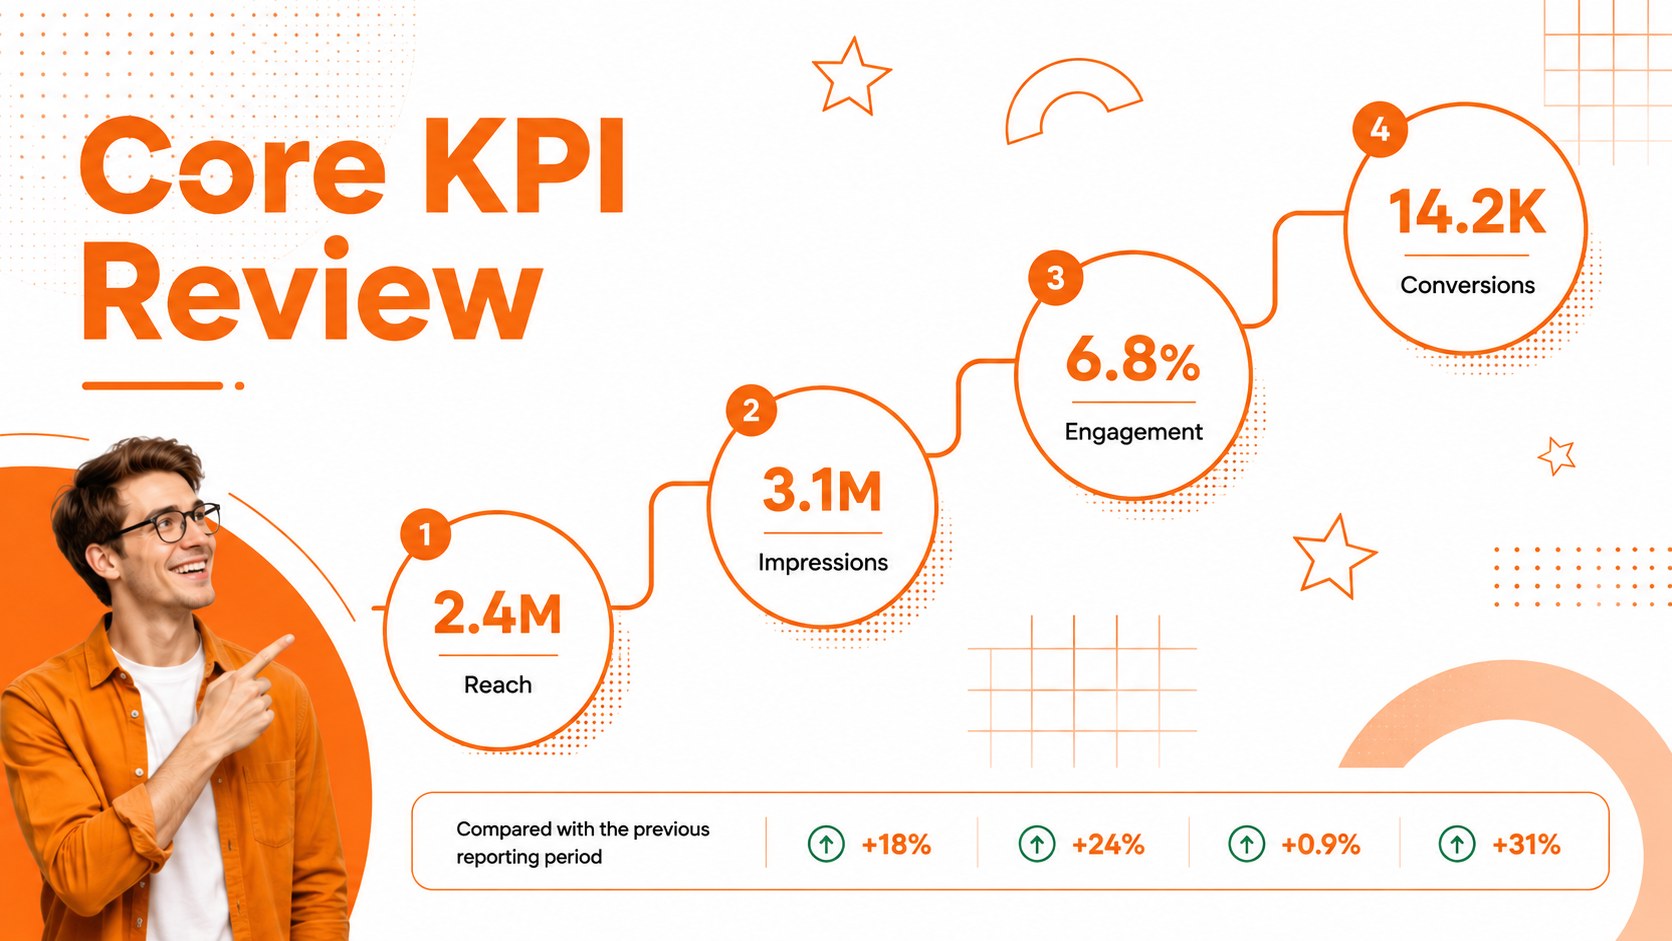
Every slide in the template. Ottermind keeps this look and writes your own content into it.

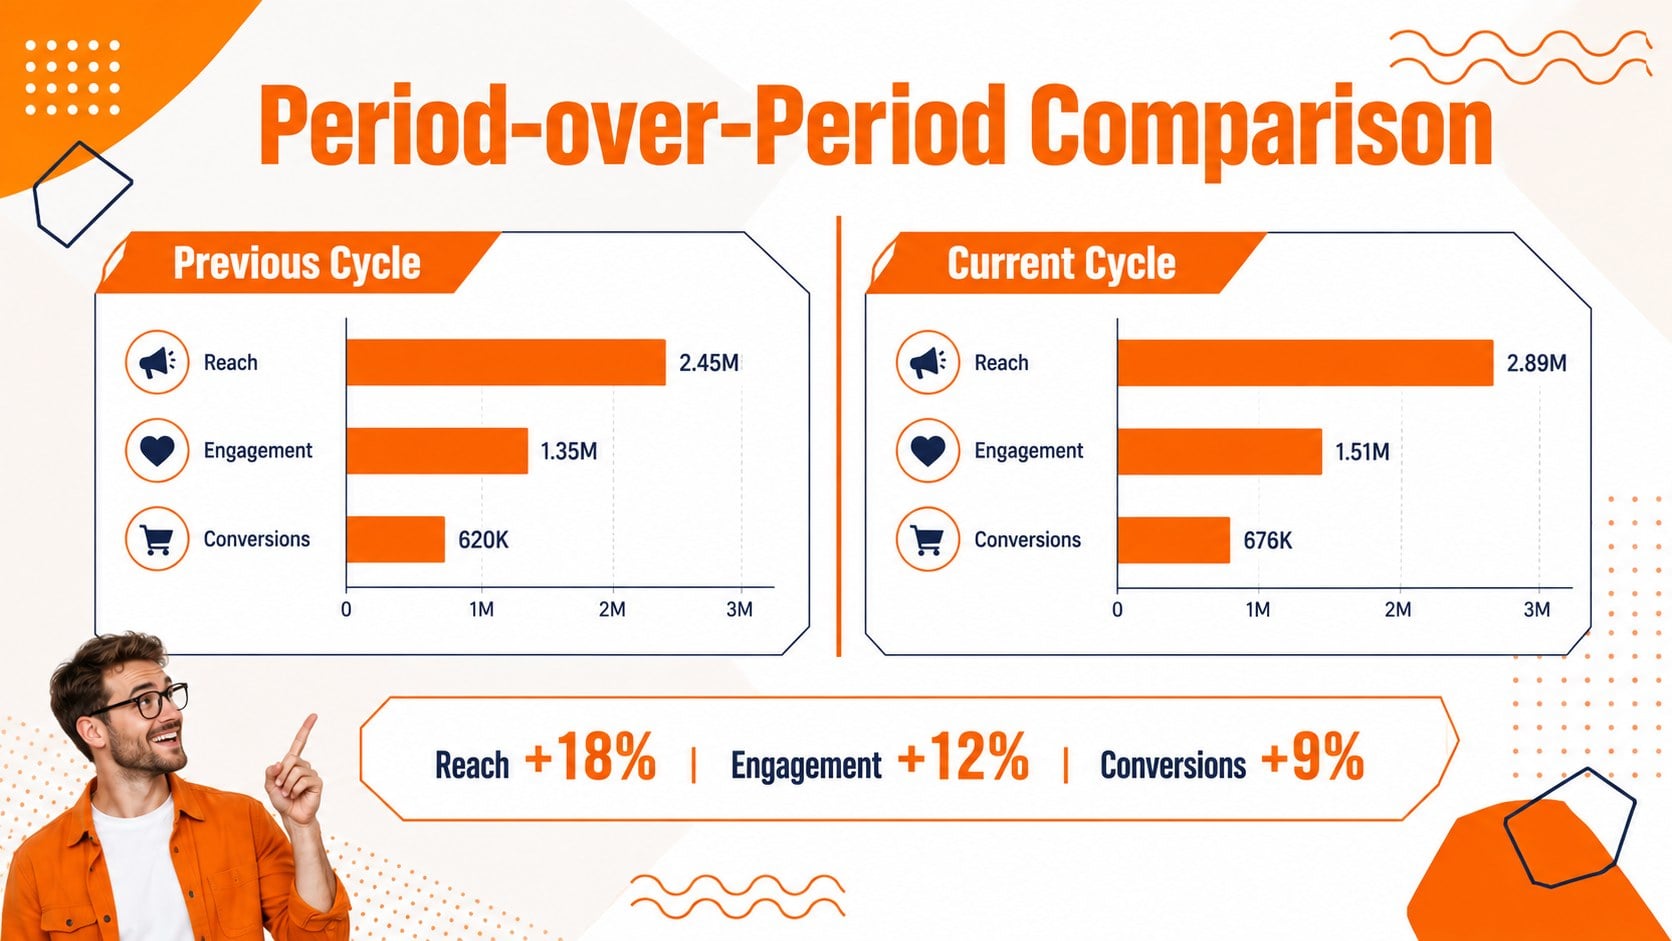
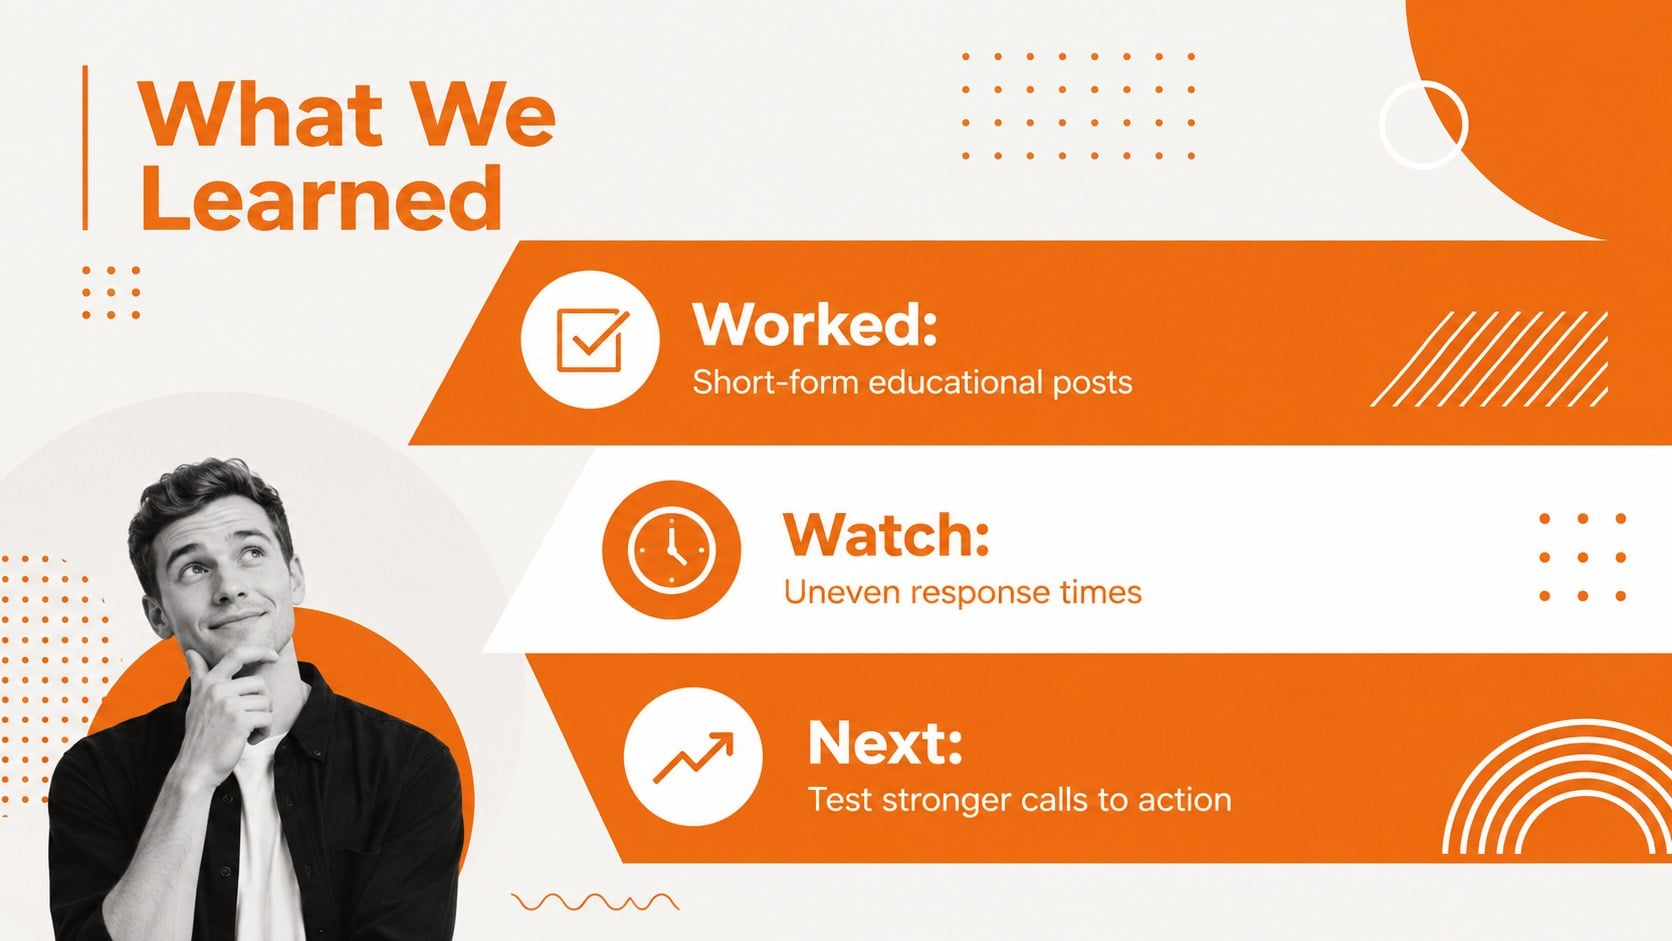

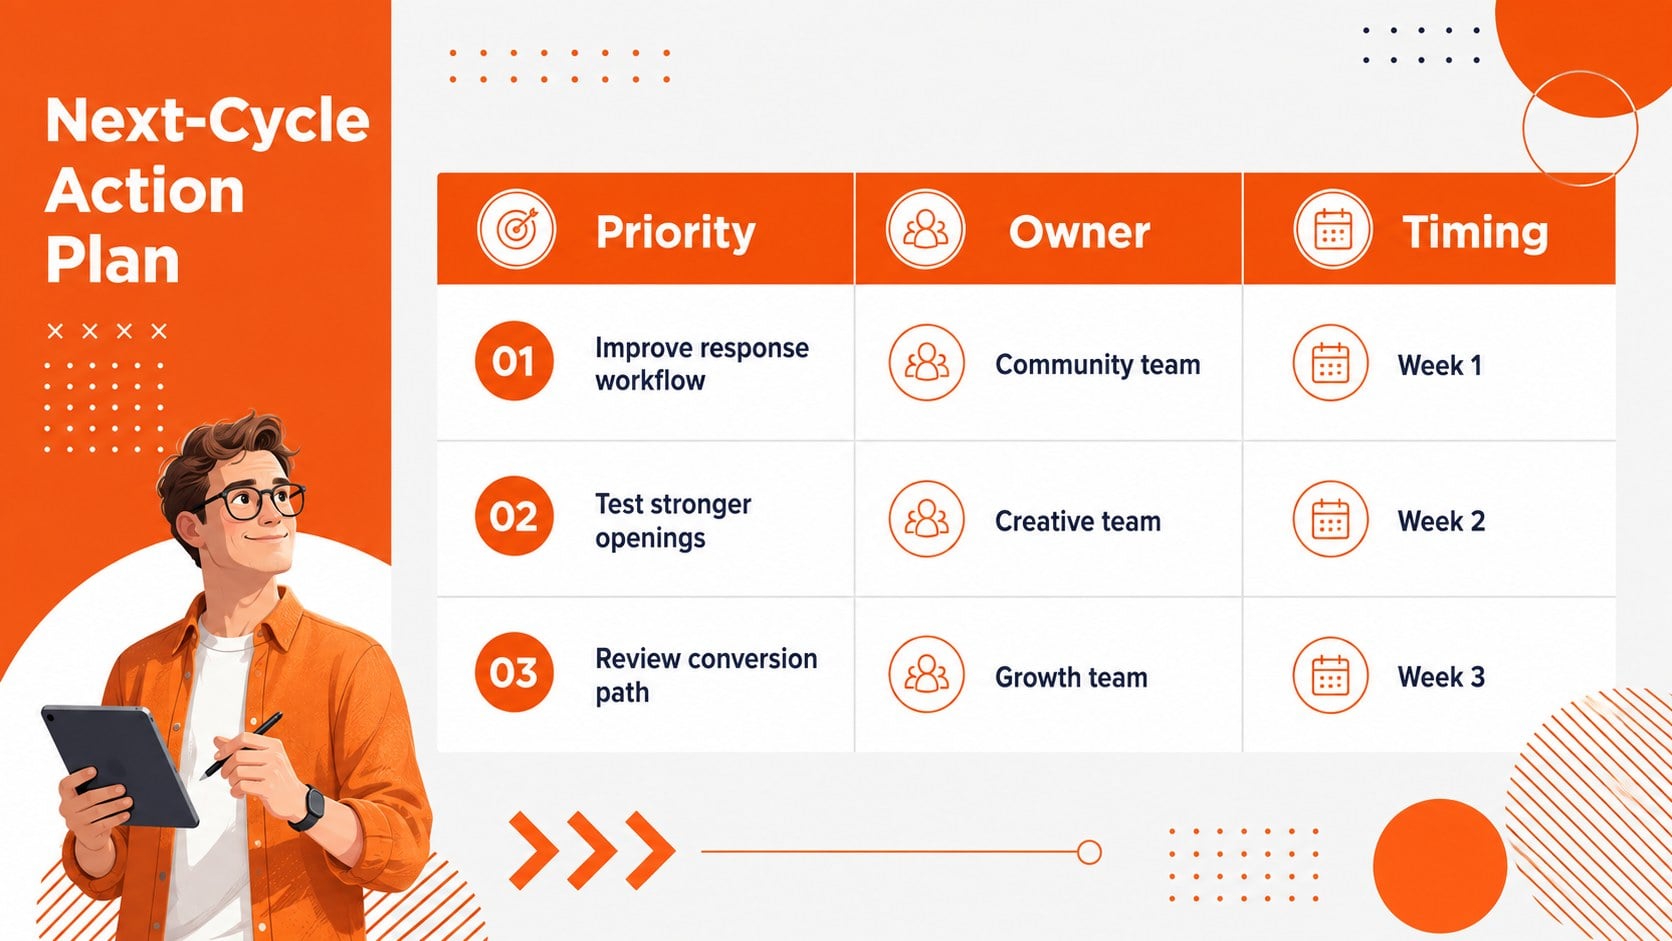
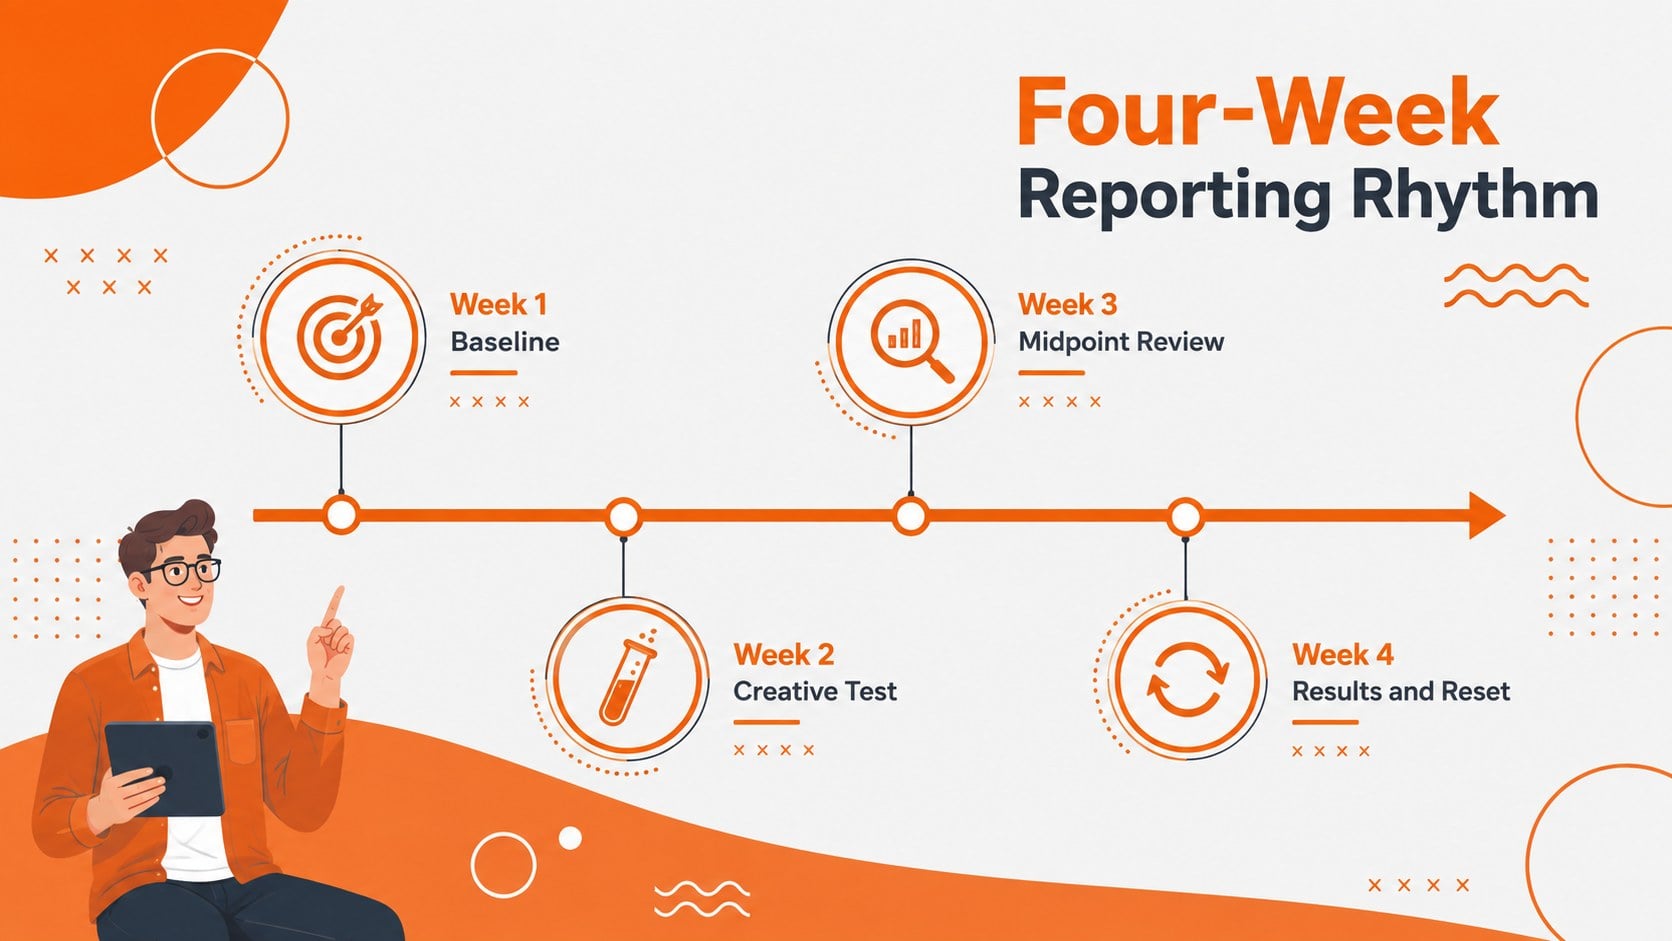

How to use this template
- 1
Click “Use this template” to open it in Ottermind Studio.
- 2
Describe your topic, audience and key points — or attach notes and files.
- 3
Ottermind generates an editable deck in this style. Edit text, adjust slides and export.
Tags
- Social Analytics
- Campaign Reporting
- Cycle Diagrams
- Data Visualization
- Marketing Metrics
- KPI Dashboard
- Orange And White
- Memphis Style
- Performance Review
- Process Flow
- Audience Insights
- Strategy Planning
More Creative & Themes templates
 Ice Hockey Fundamentals Training Deck4 slides
 Watercolor Ecology Presentation Theme16 slides
 Red Triangle Editorial Theme16 slides
 Annual Listening Recap Slide Deck15 slides
 Colorful Year in Review Slide Deck15 slides
 Standout Colleague Recommendation Letter Slides3 slides
 Astrology Birth Chart Basics Theme14 slides
 Celestial Personality Profiles Infographic3 slides
Make your deck with Cycle-Based Social Performance Dashboard
Pick this style, describe your topic, and get an editable presentation in minutes.